 1
1peptide
spectra
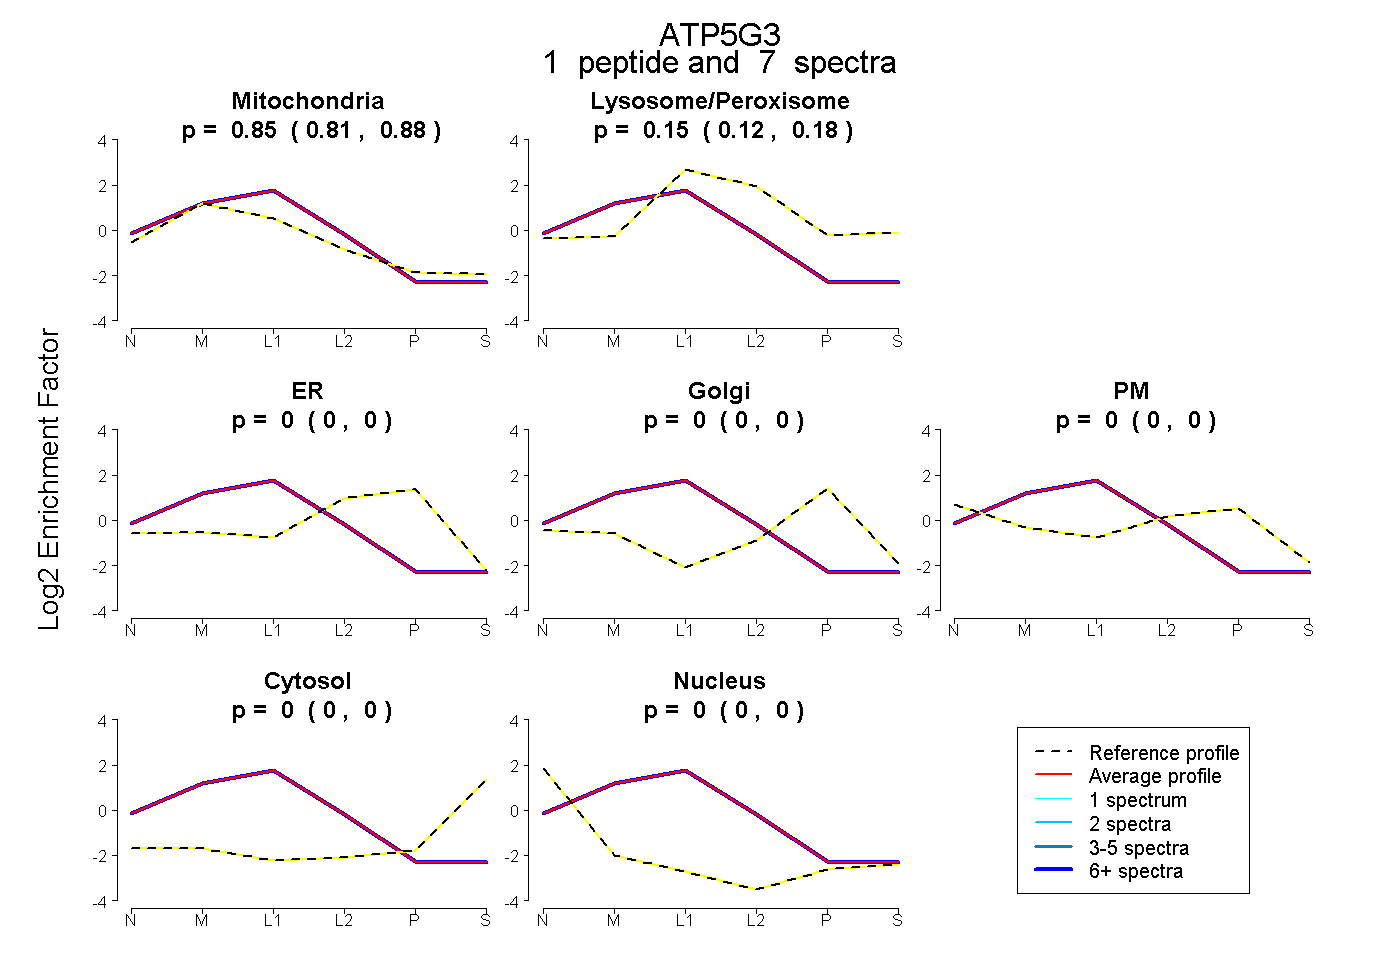
0.814 | 0.875
0.119 | 0.181
0.000 | 0.000
0.000 | 0.000
0.000 | 0.000
0.000 | 0.000
0.000 | 0.000
1peptide
spectra
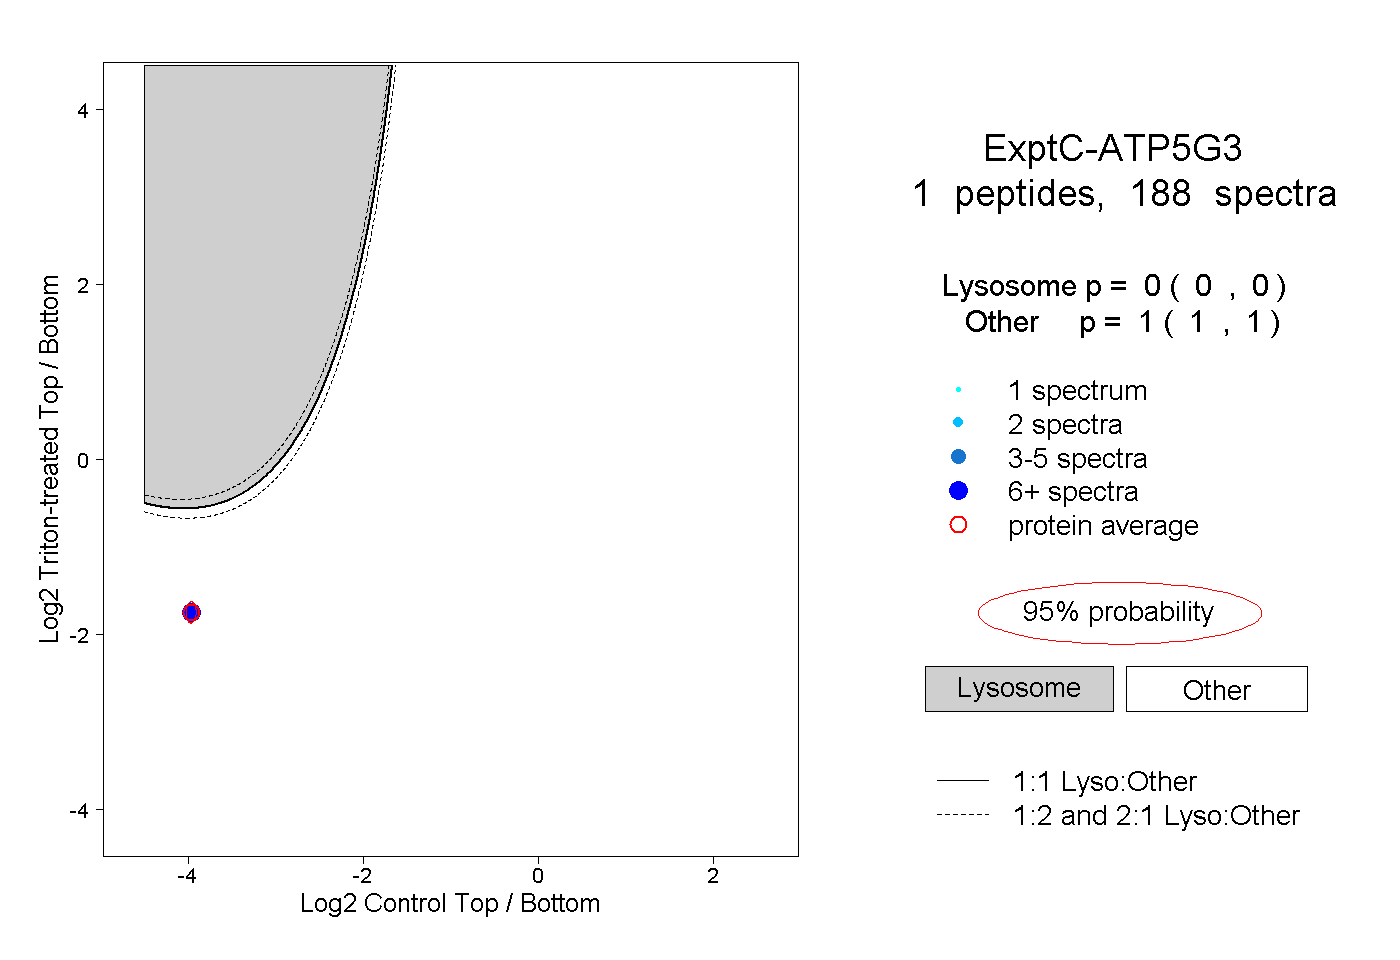
0.000 | 0.000
1.000 | 1.000
1peptide
spectra
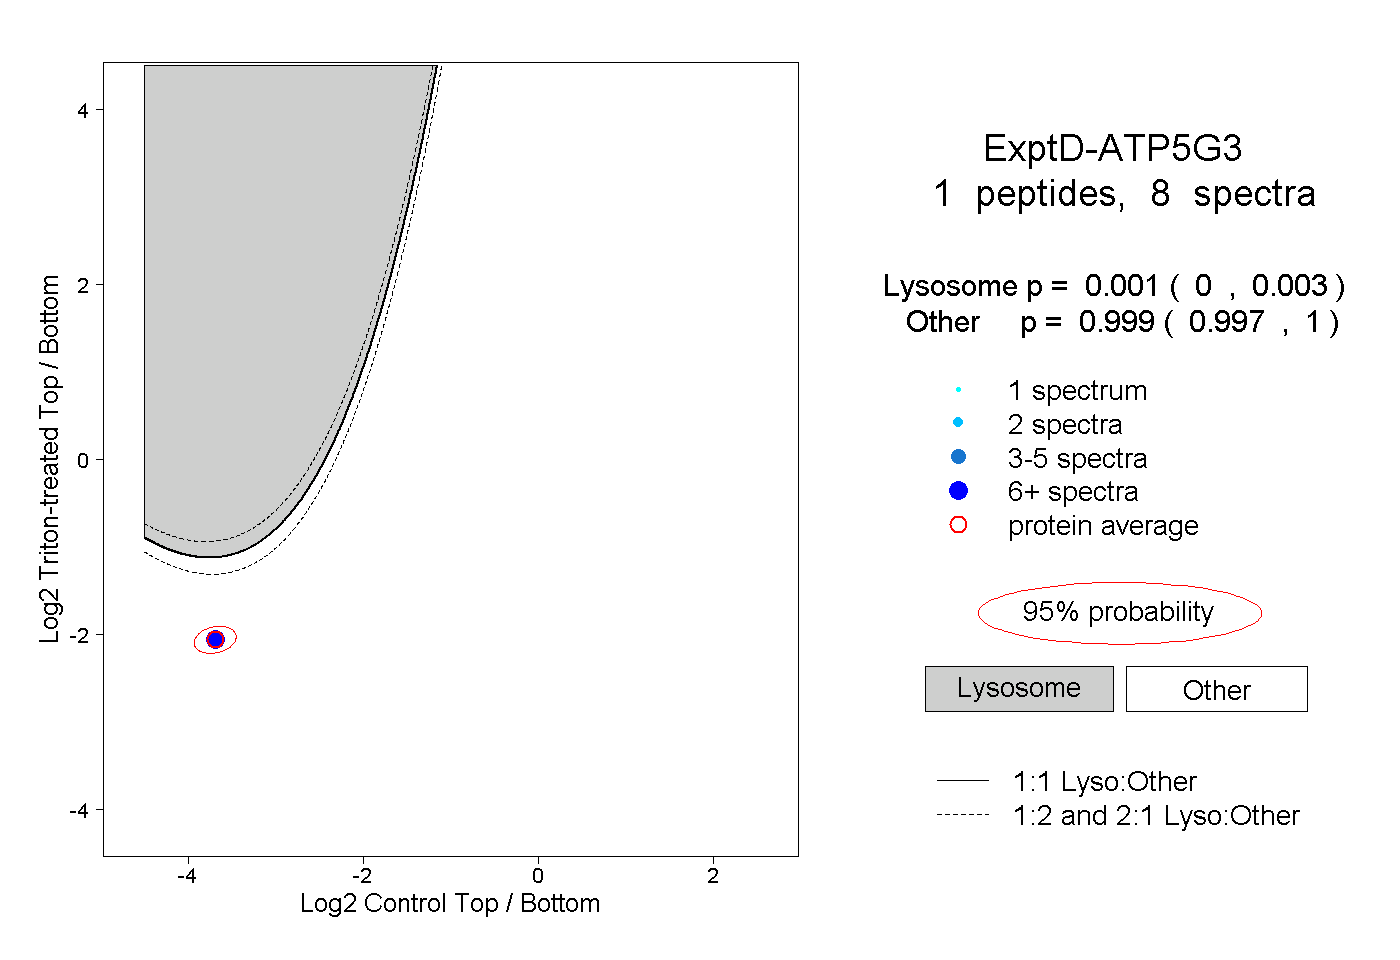
0.000 | 0.003
0.997 | 1.000