 17
17peptides
spectra
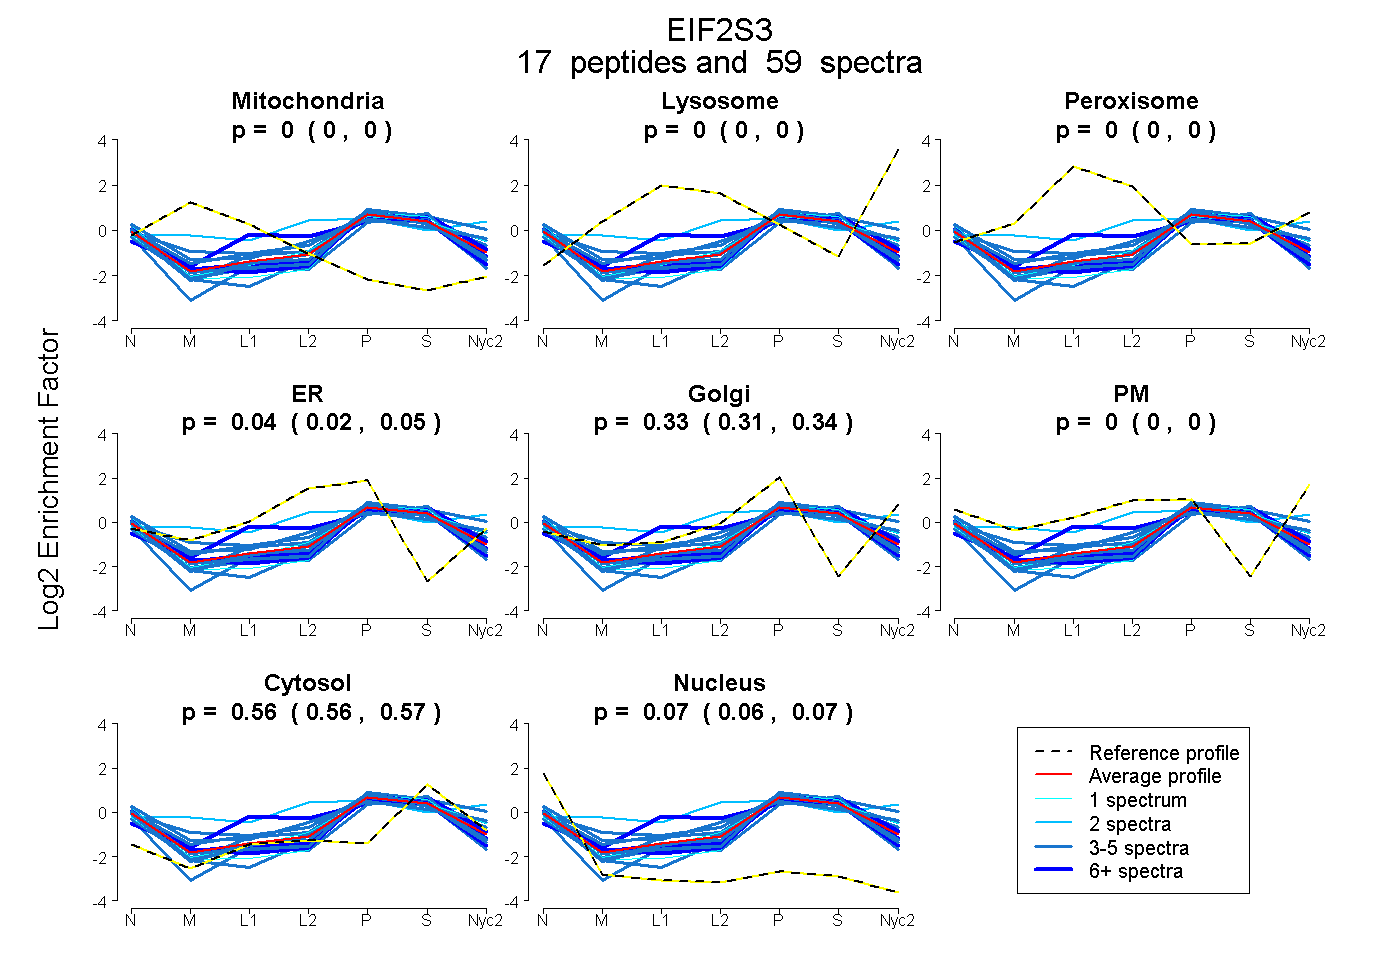
0.000 | 0.000
0.000 | 0.000
0.000 | 0.000
0.024 | 0.053
0.312 | 0.344
0.000 | 0.000
0.560 | 0.565
0.063 | 0.070
11peptides
spectra
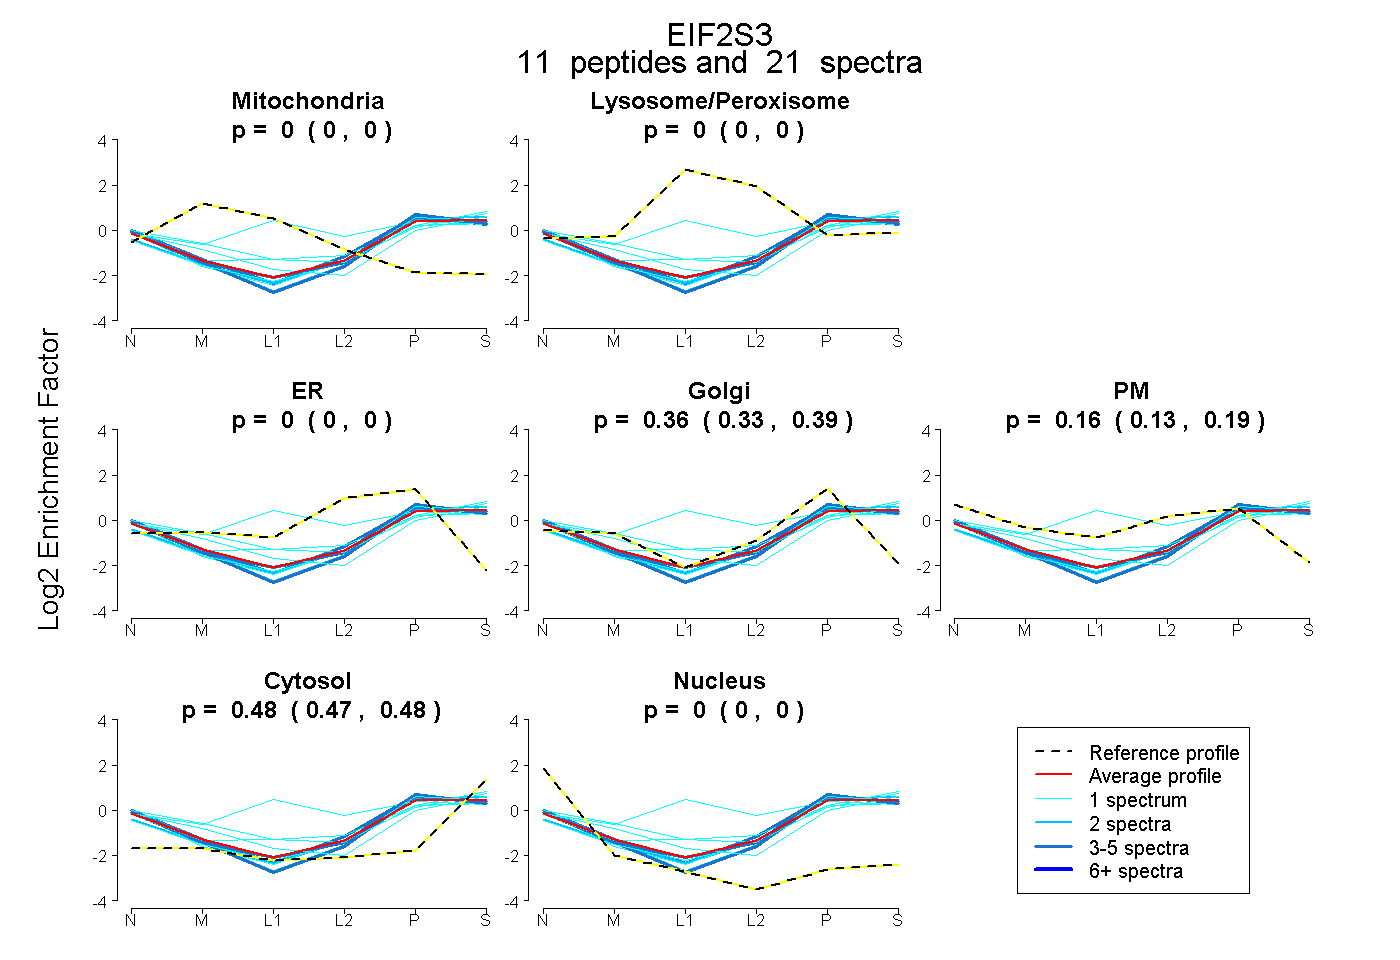
0.000 | 0.000
0.000 | 0.000
0.000 | 0.000
0.333 | 0.386
0.134 | 0.187
0.471 | 0.482
0.000 | 0.000
17peptides
spectra
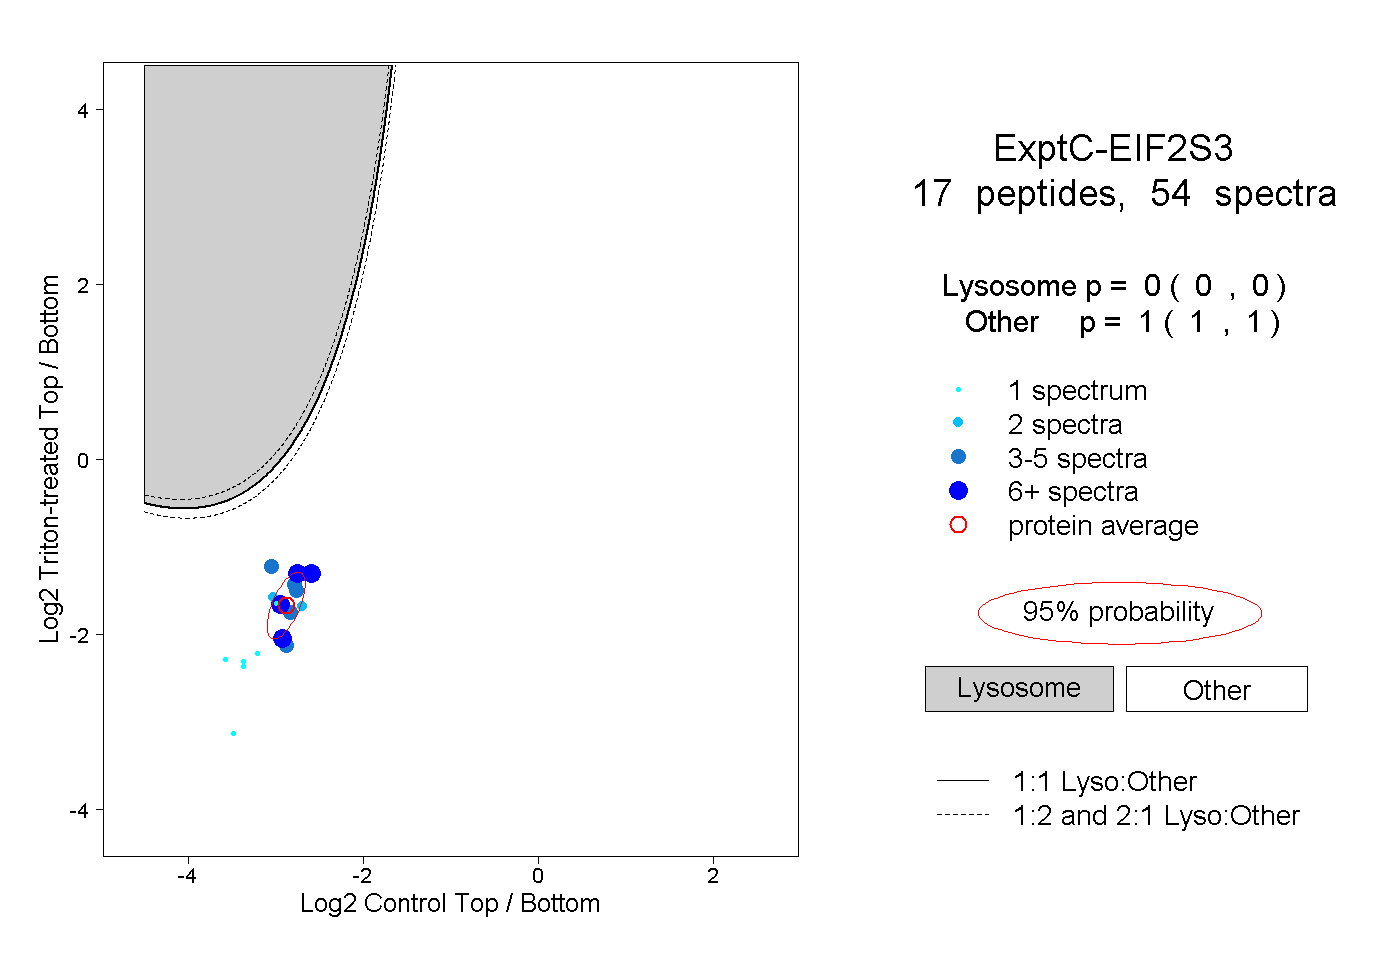
0.000 | 0.000
1.000 | 1.000
2peptides
spectra
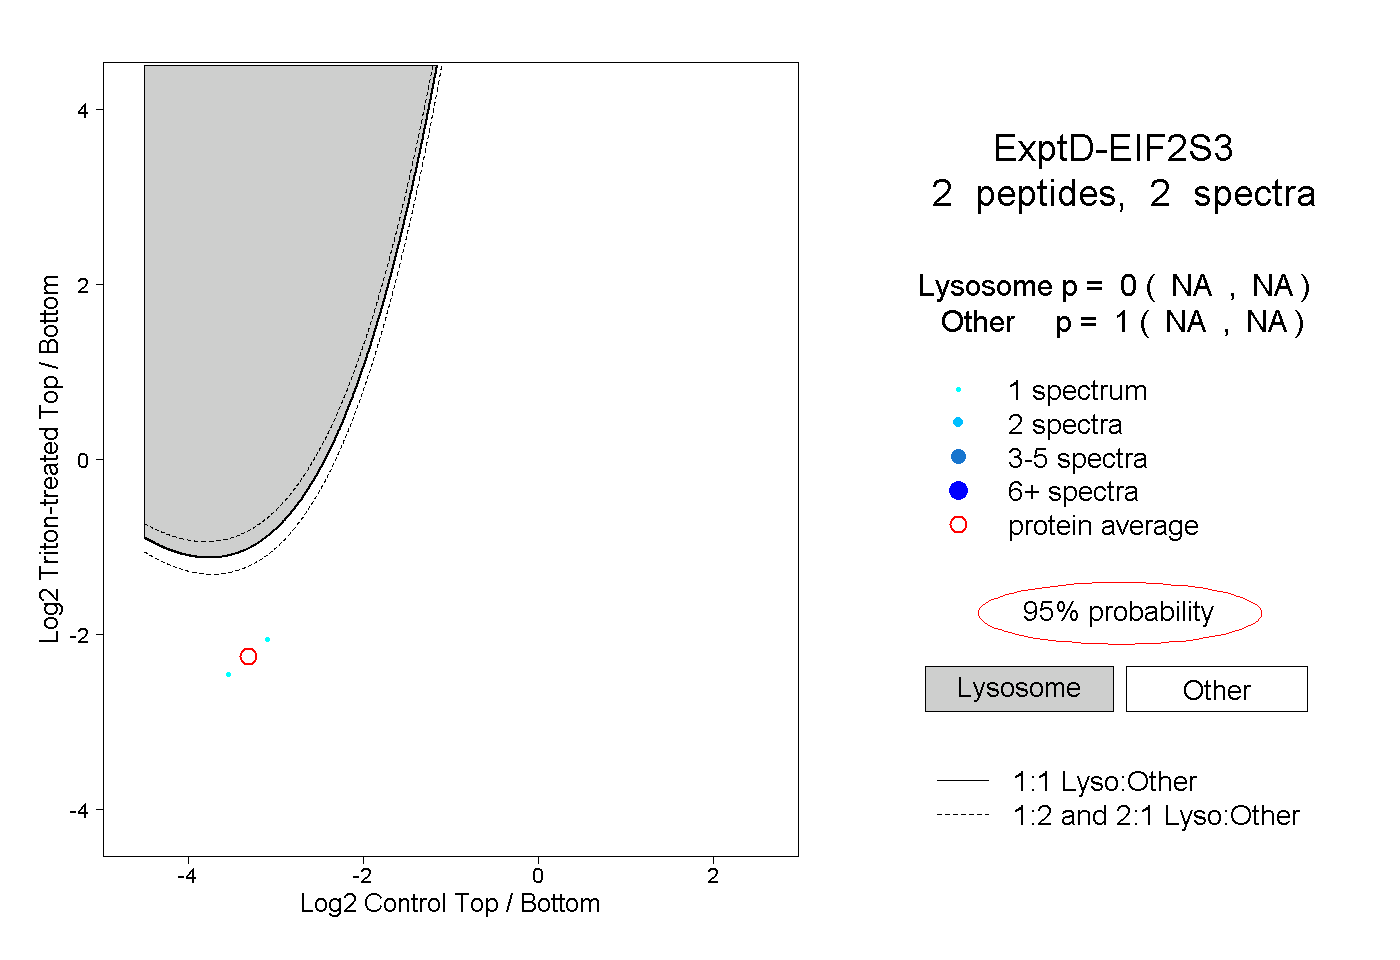
NA | NA
NA | NA