 4
4peptides
spectra
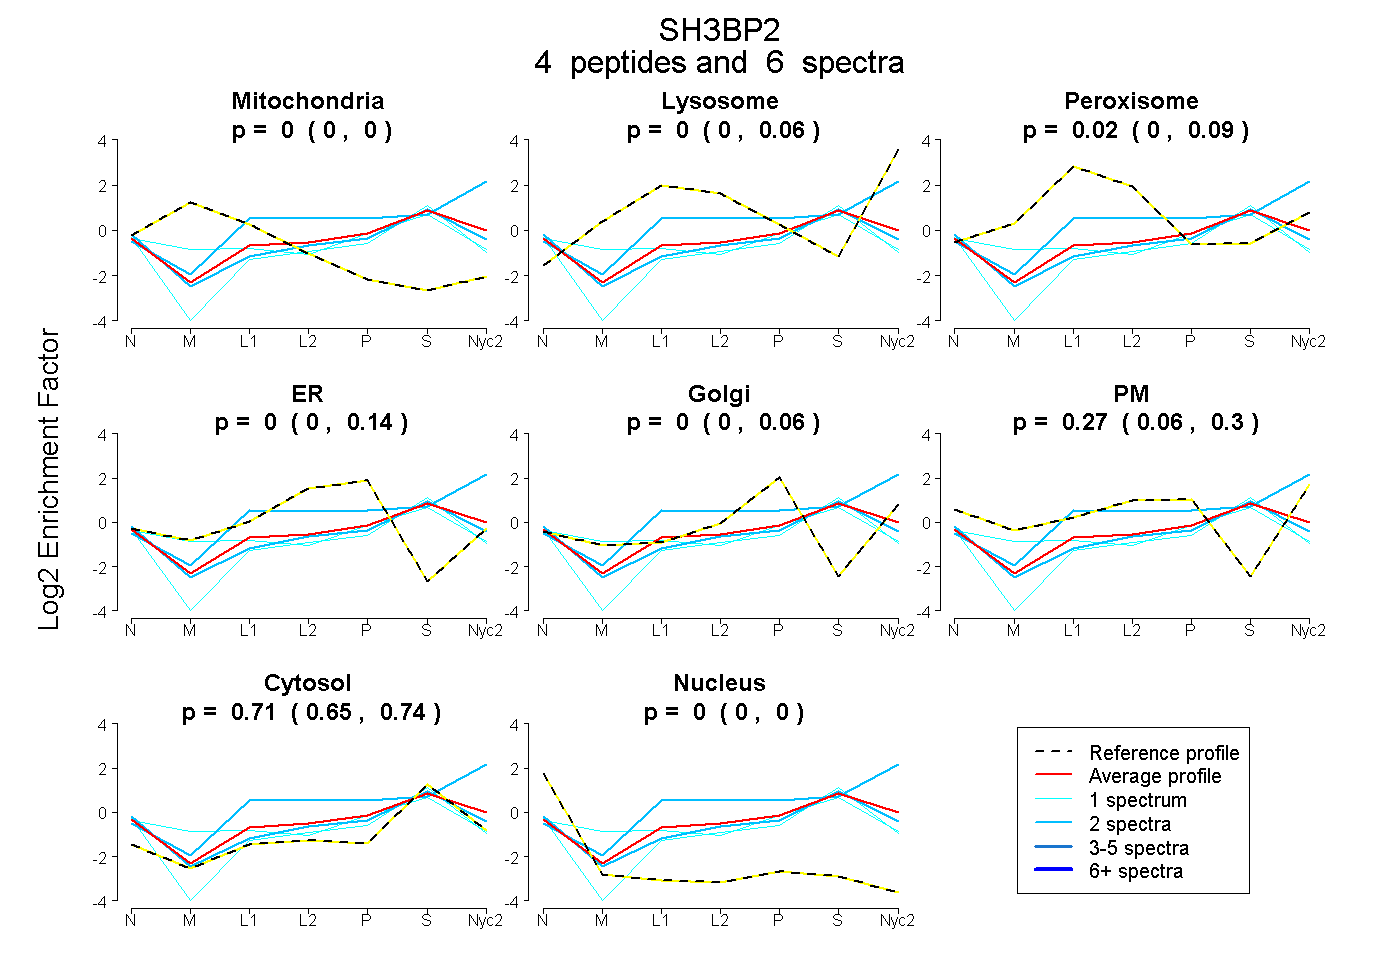
0.000 | 0.000
0.000 | 0.063
0.000 | 0.090
0.000 | 0.138
0.000 | 0.056
0.062 | 0.295
0.648 | 0.743
0.000 | 0.000
2peptides
spectra
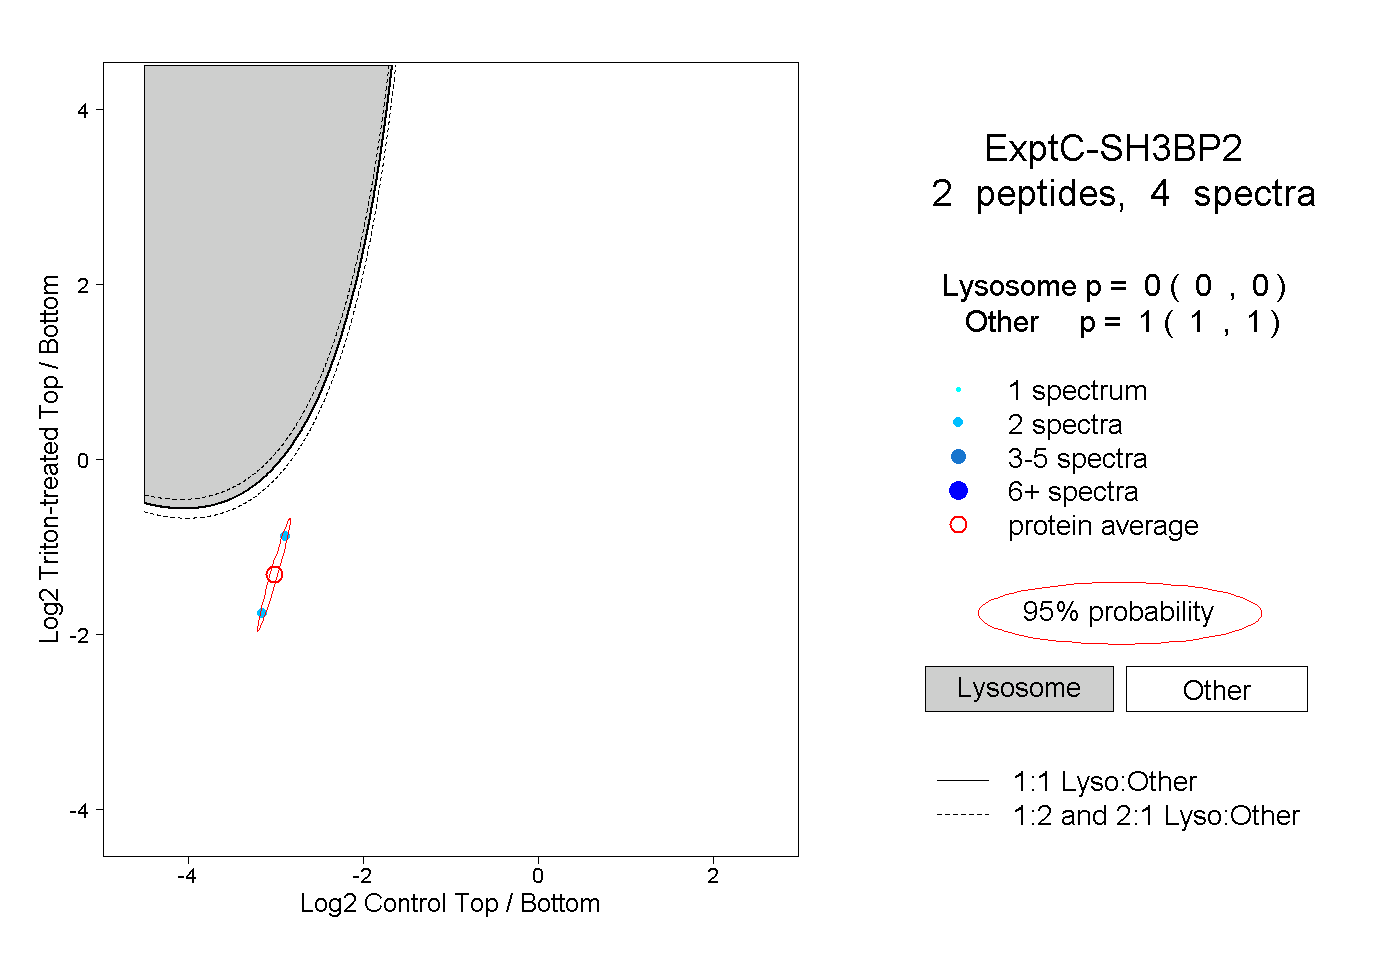
0.000 | 0.000
1.000 | 1.000
1peptide
spectrum
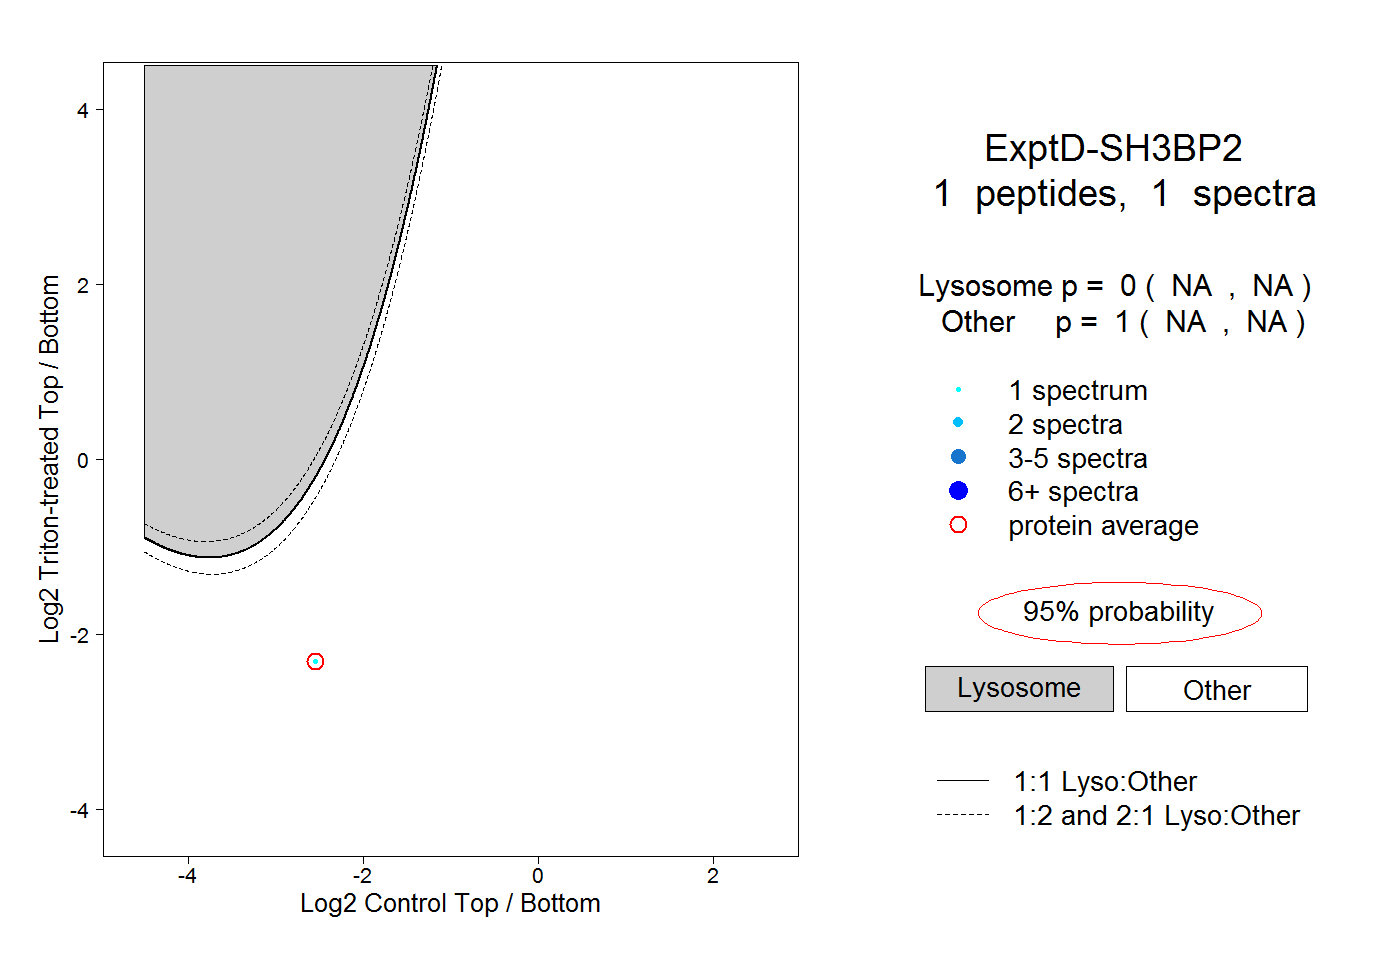
NA | NA
NA | NA