 21
21peptides
spectra
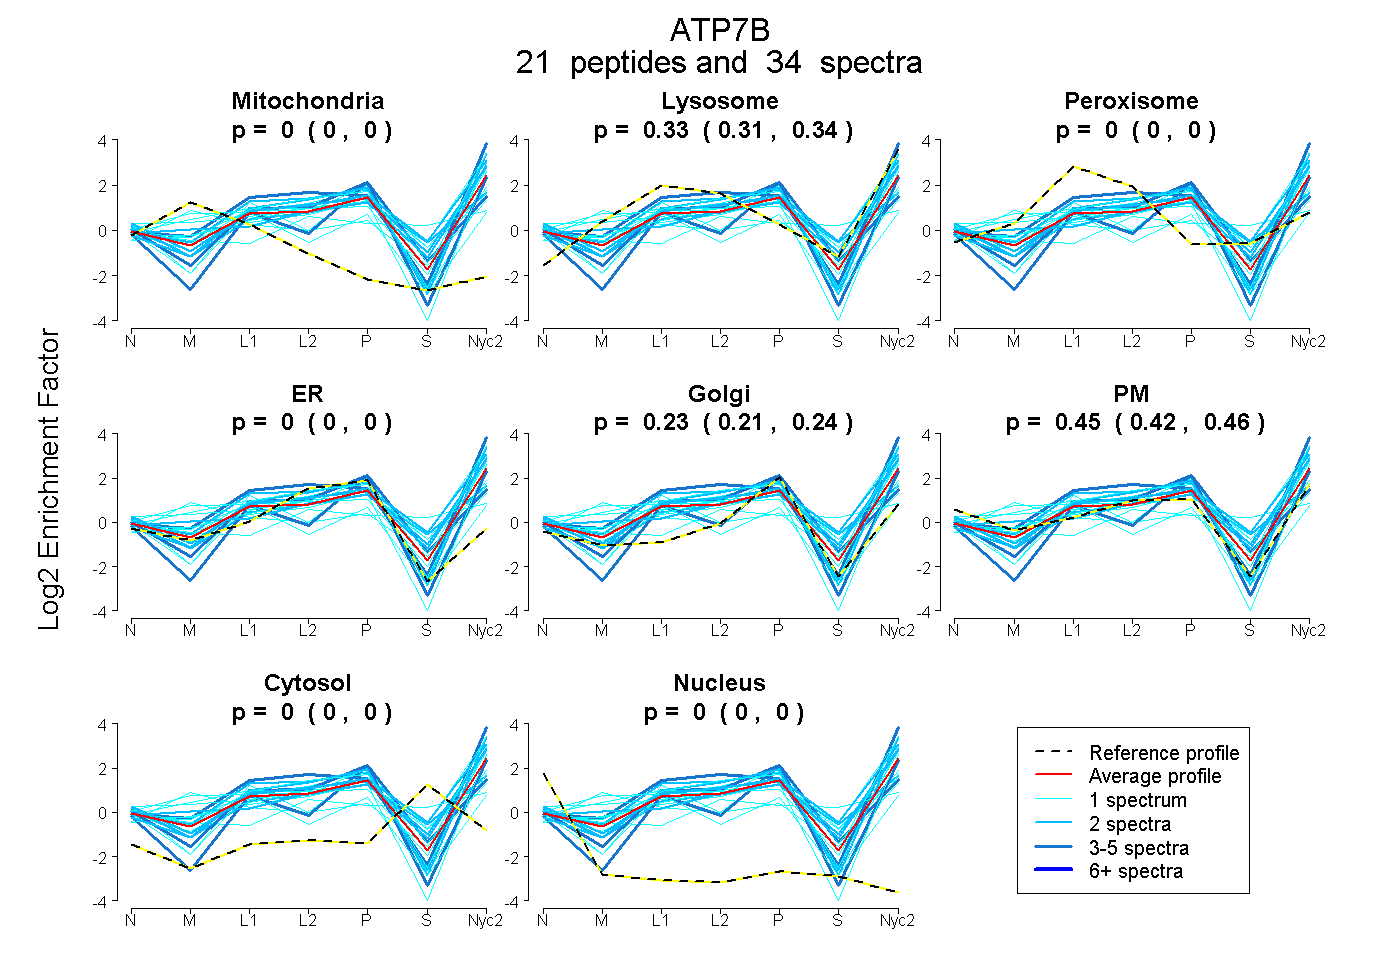
0.000 | 0.000
0.314 | 0.336
0.000 | 0.000
0.000 | 0.000
0.212 | 0.243
0.424 | 0.463
0.000 | 0.000
0.000 | 0.000
5peptides
spectra
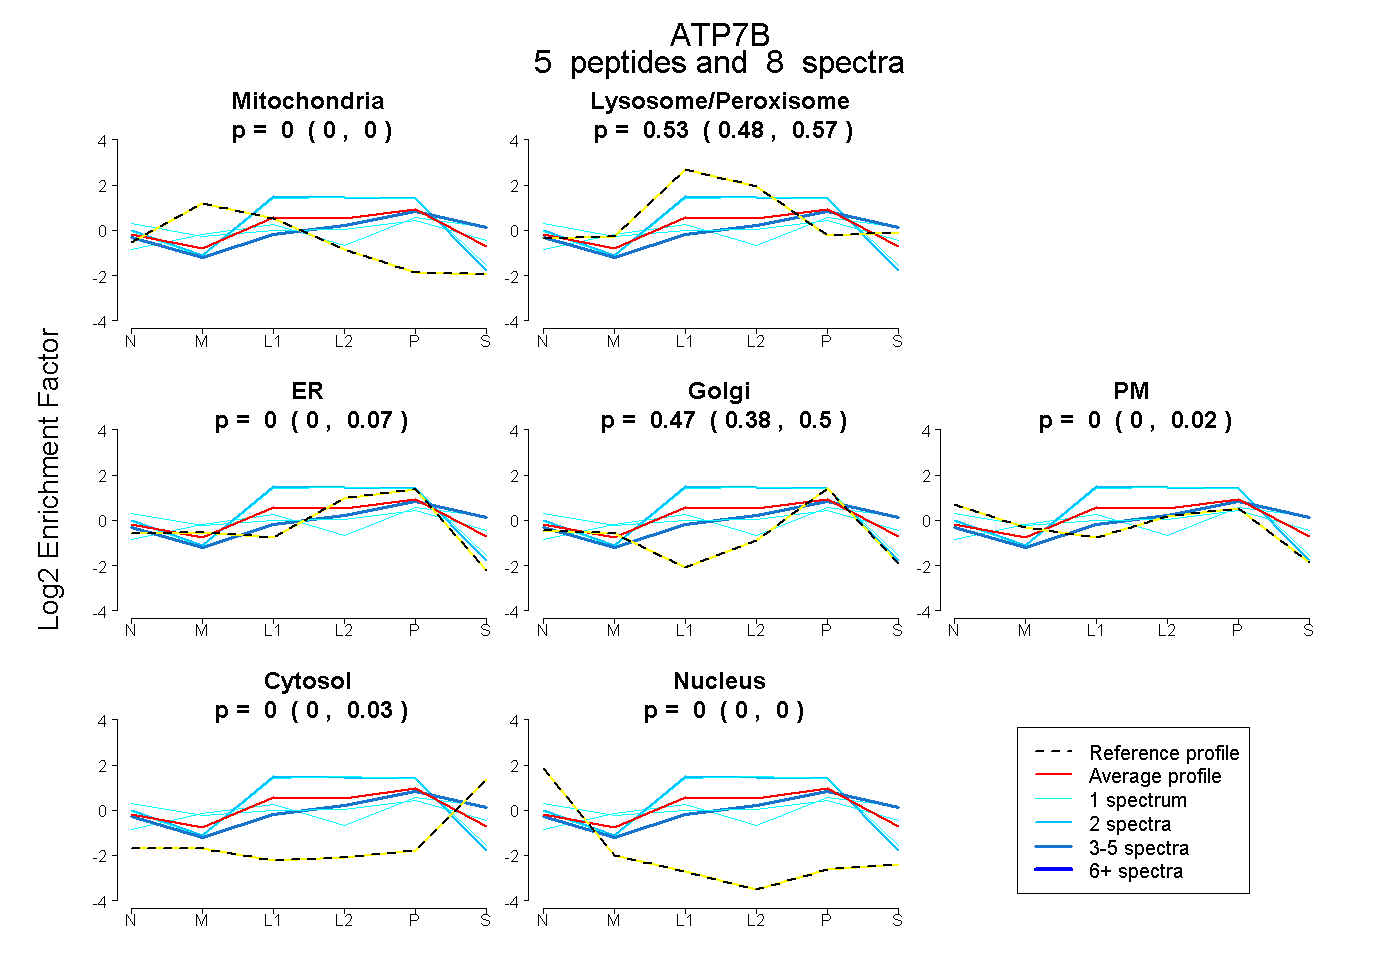
0.000 | 0.000
0.479 | 0.565
0.000 | 0.071
0.378 | 0.497
0.000 | 0.021
0.000 | 0.030
0.000 | 0.003
27peptides
spectra
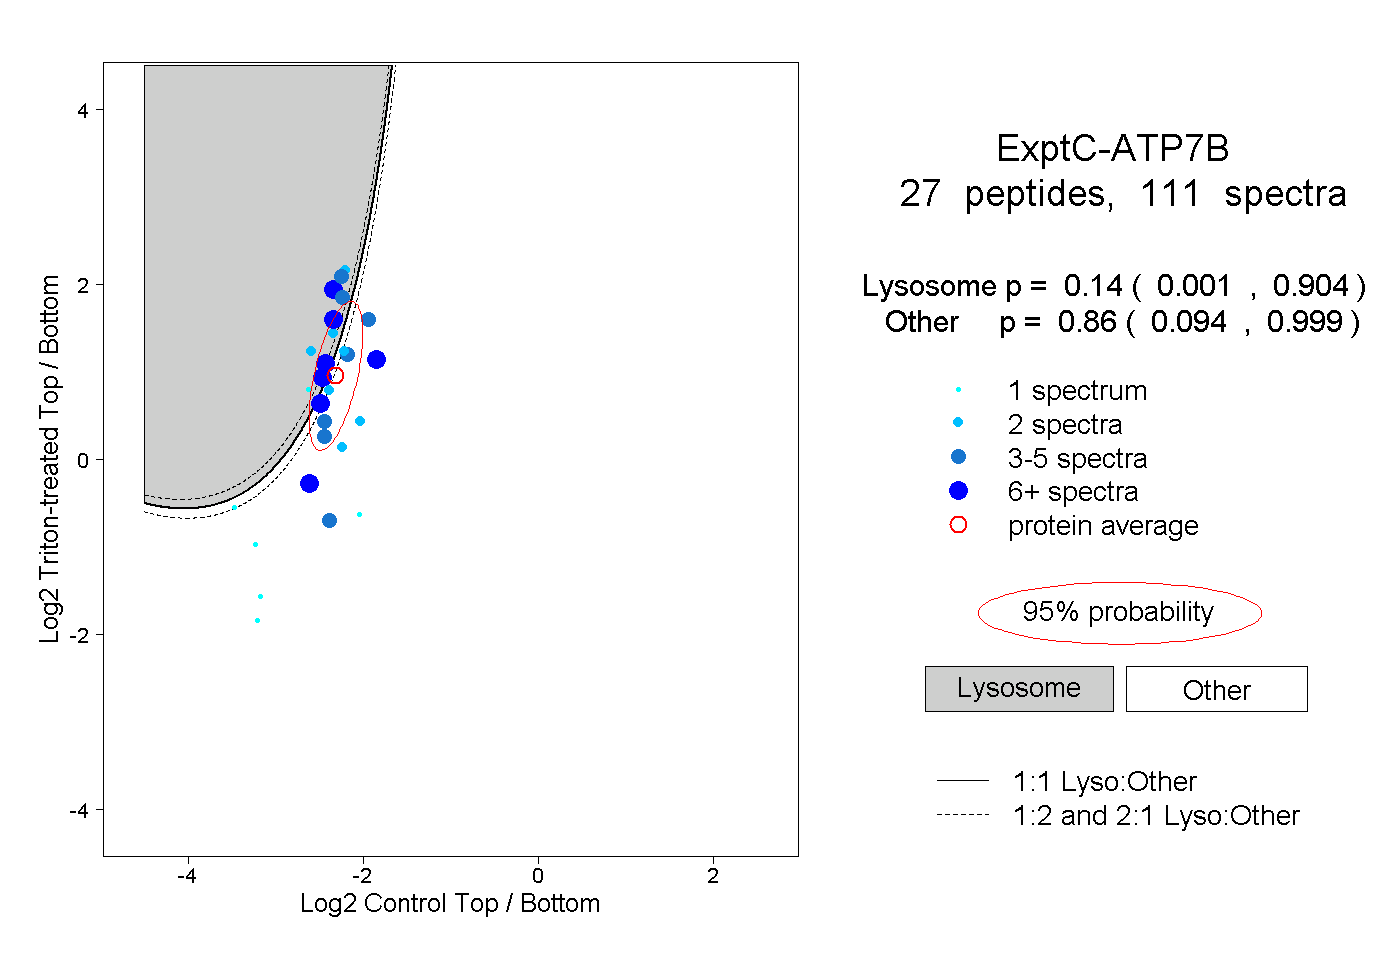
0.001 | 0.904
0.094 | 0.999
5peptides
spectra
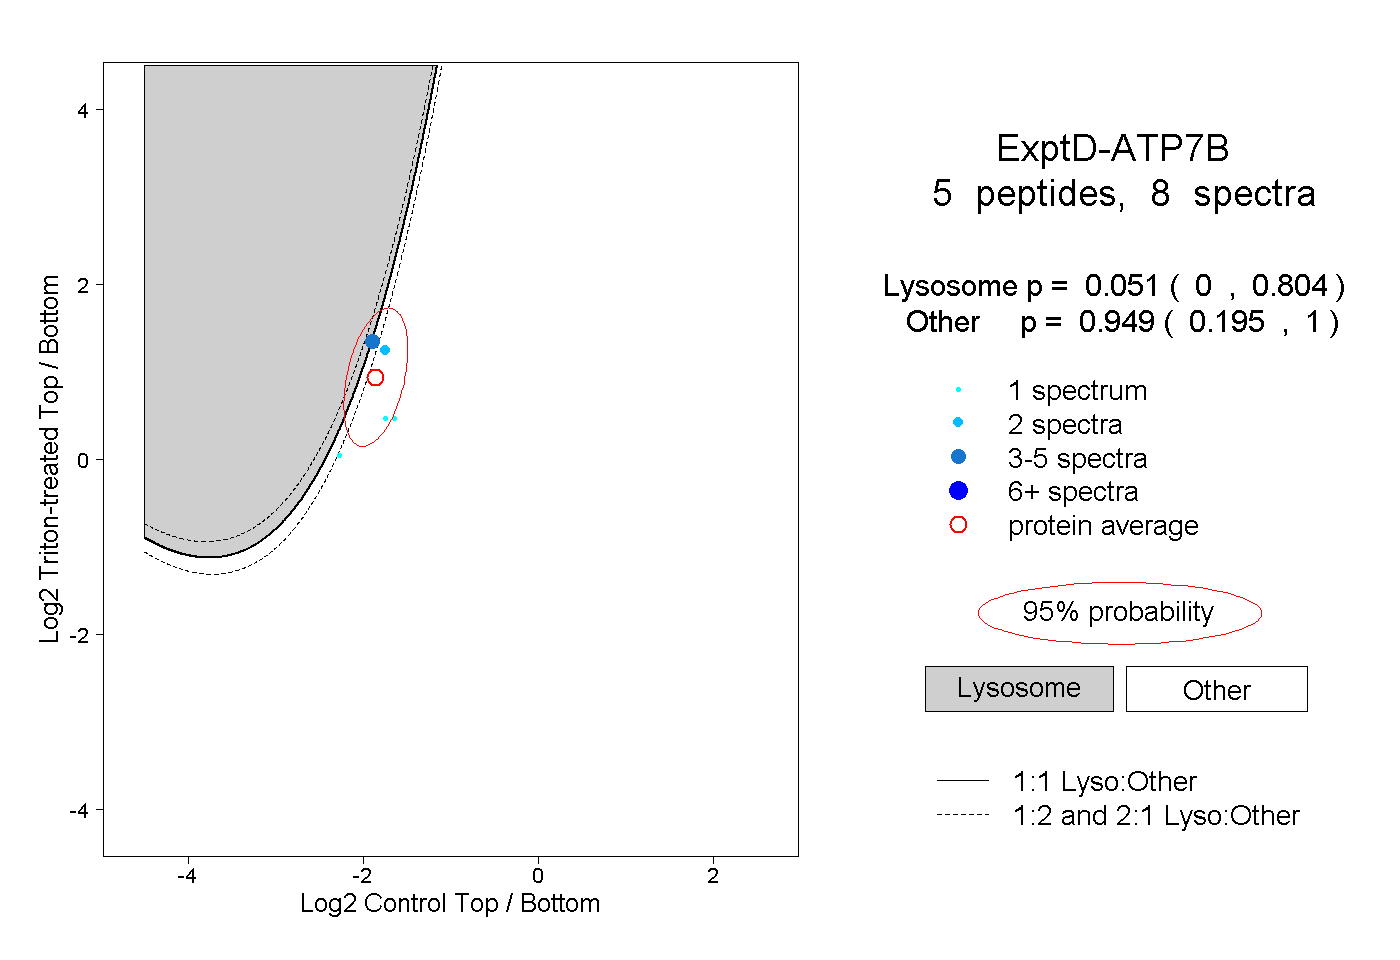
0.000 | 0.804
0.195 | 1.000