 9
9peptides
spectra
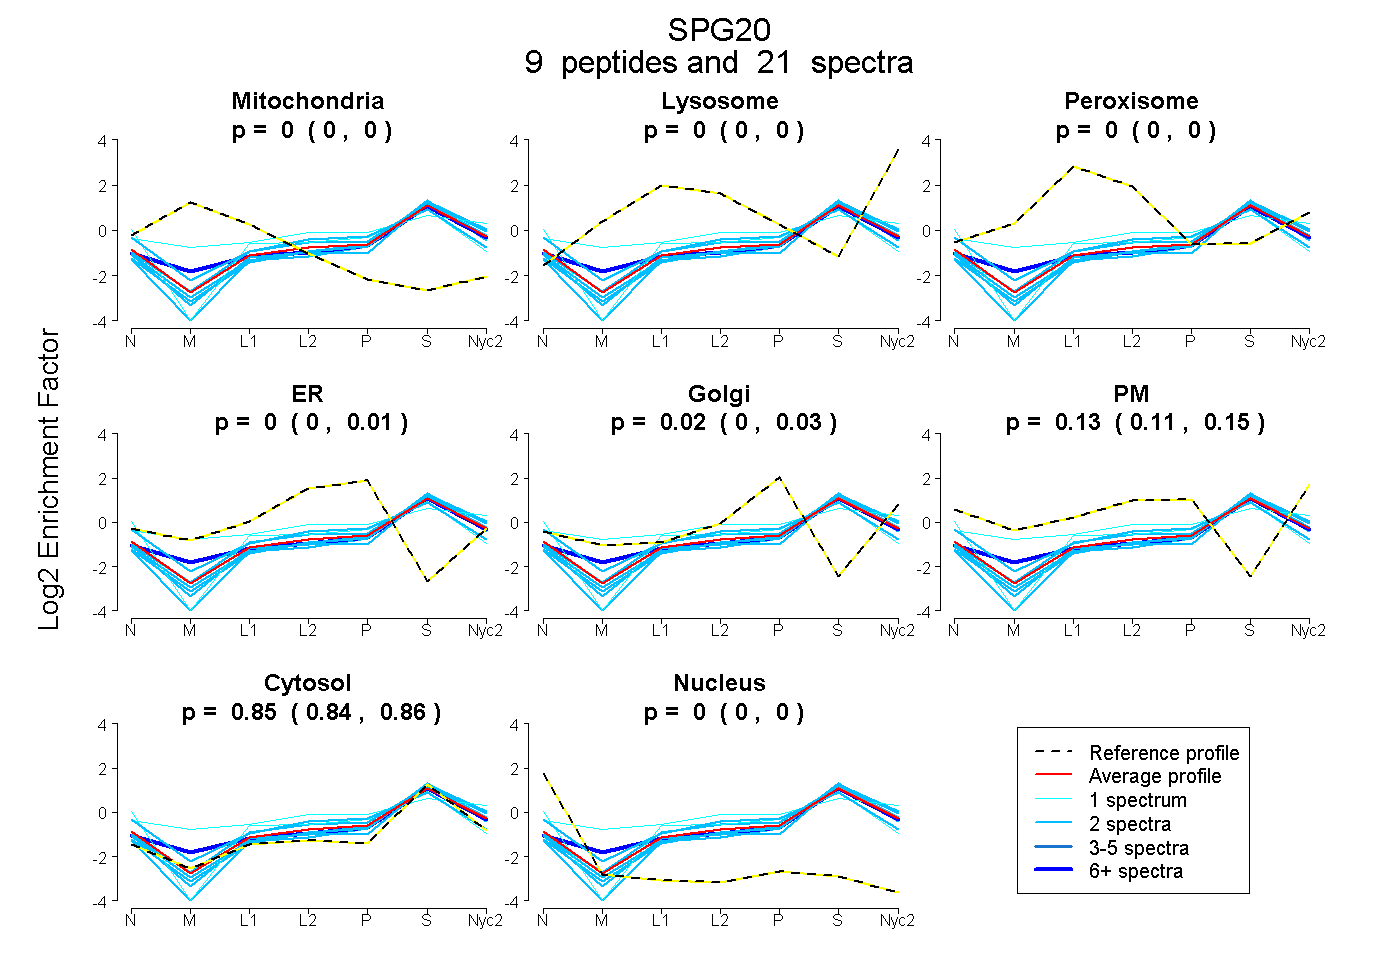
0.000 | 0.000
0.000 | 0.001
0.000 | 0.000
0.000 | 0.006
0.000 | 0.033
0.112 | 0.152
0.842 | 0.855
0.000 | 0.000
| Plot | Mito | Lyso | Perox | ER | Golgi | PM | Cytosol | Nucleus | |||||
| Expt A |
9 peptides |
21 spectra |
|
0.000 0.000 | 0.000 |
0.000 0.000 | 0.001 |
0.000 0.000 | 0.000 |
0.000 0.000 | 0.006 |
0.016 0.000 | 0.033 |
0.134 0.112 | 0.152 |
0.850 0.842 | 0.855 |
0.000 0.000 | 0.000 |
| 2 spectra, AFMFVNK | 0.000 | 0.000 | 0.000 | 0.000 | 0.030 | 0.000 | 0.970 | 0.000 | ||
| 2 spectra, ELAPHVK | 0.000 | 0.029 | 0.000 | 0.000 | 0.074 | 0.000 | 0.897 | 0.000 | ||
| 1 spectrum, NDLQDVPK | 0.000 | 0.000 | 0.000 | 0.171 | 0.000 | 0.000 | 0.794 | 0.035 | ||
| 2 spectra, QMVLCEPSSEEK | 0.000 | 0.000 | 0.023 | 0.197 | 0.000 | 0.032 | 0.748 | 0.000 | ||
| 2 spectra, GLYIAK | 0.000 | 0.087 | 0.000 | 0.003 | 0.040 | 0.057 | 0.813 | 0.000 | ||
| 7 spectra, DLPEWSEK | 0.000 | 0.050 | 0.009 | 0.000 | 0.055 | 0.067 | 0.819 | 0.000 | ||
| 1 spectrum, QATGGAAK | 0.000 | 0.039 | 0.140 | 0.000 | 0.000 | 0.279 | 0.542 | 0.000 | ||
| 2 spectra, EASGTDVR | 0.000 | 0.037 | 0.000 | 0.000 | 0.000 | 0.038 | 0.925 | 0.000 | ||
| 2 spectra, DSSSEEVSLR | 0.000 | 0.012 | 0.000 | 0.000 | 0.109 | 0.000 | 0.878 | 0.000 |
| Plot | Lyso | Other | |||||||||||
| Expt C |
6 peptides |
13 spectra |
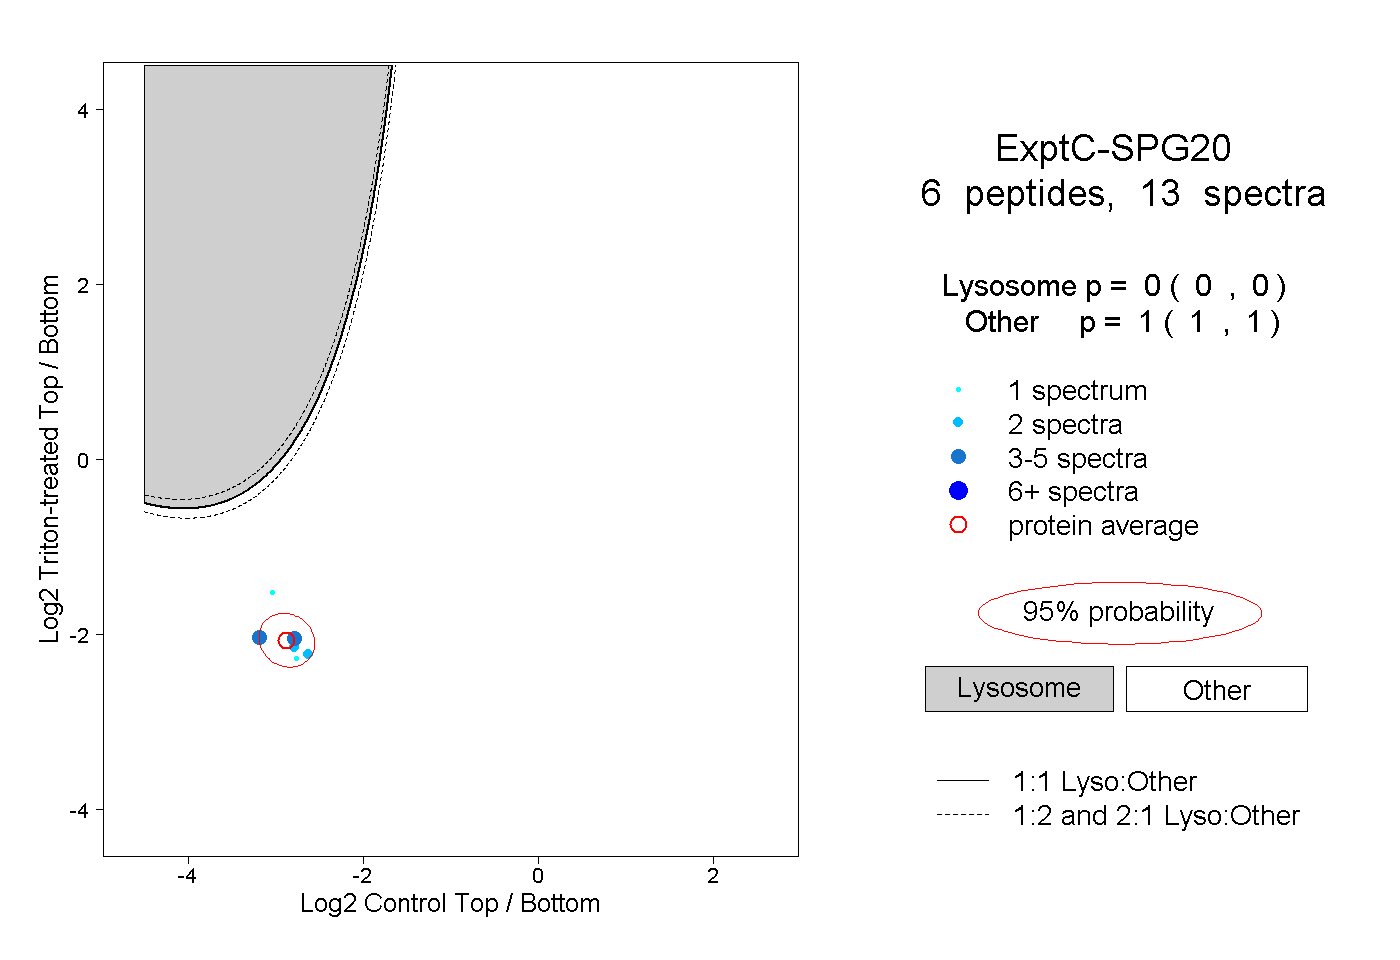 |
0.000 0.000 | 0.000 |
1.000 1.000 | 1.000 |