 1
1peptide
spectrum
NA | NA
NA | NA
NA | NA
NA | NA
NA | NA
NA | NA
NA | NA
NA | NA
| Plot | Mito | Lyso | Perox | ER | Golgi | PM | Cytosol | Nucleus | |||||
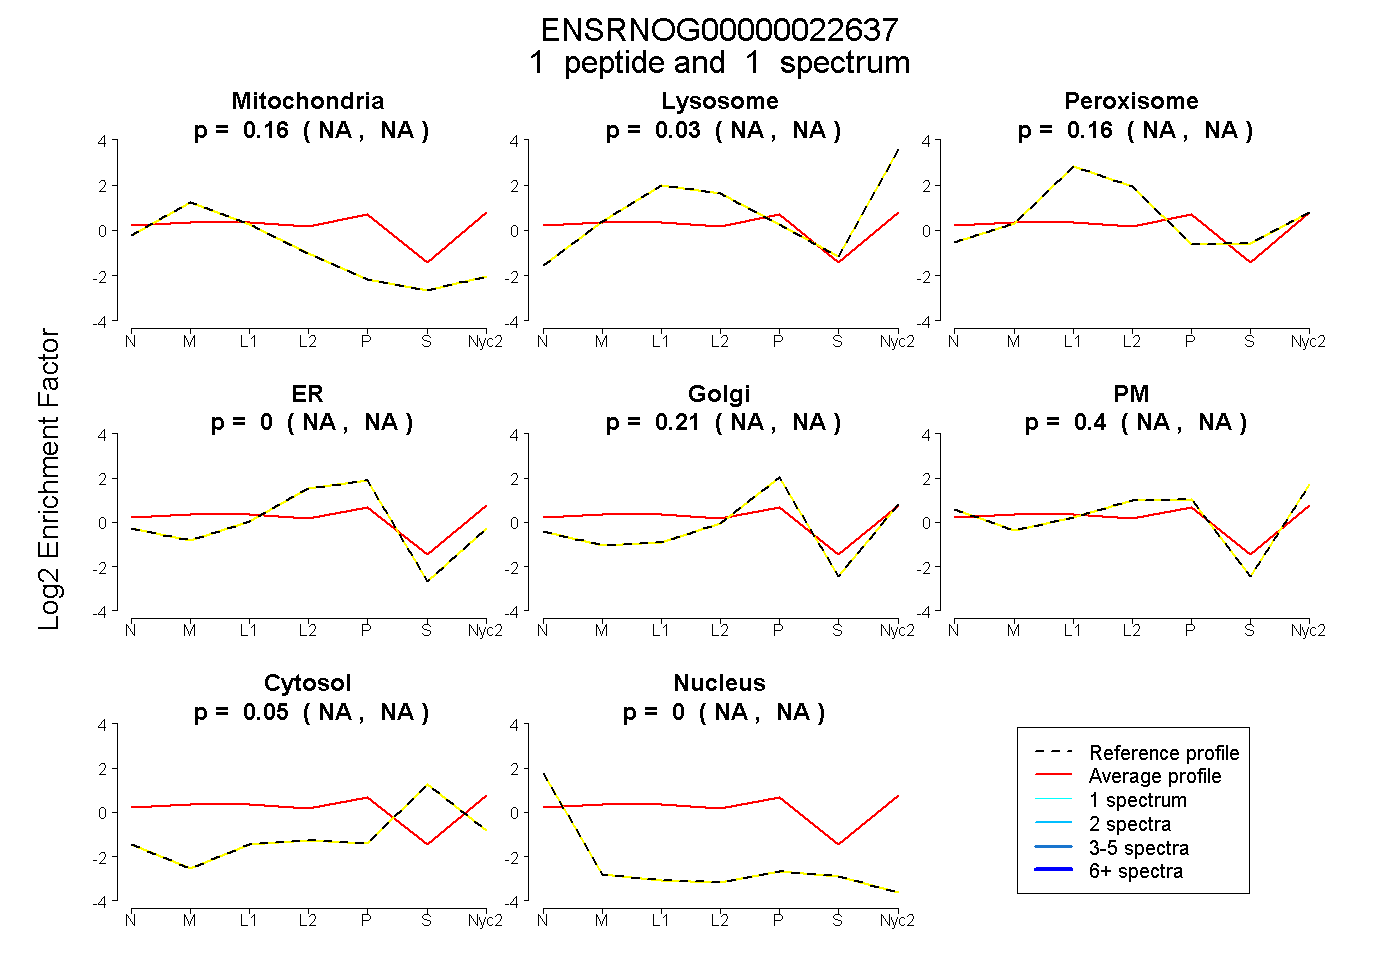
| Expt A |
1 peptide |
1 spectrum |
|
0.159 NA | NA |
0.031 NA | NA |
0.158 NA | NA |
0.000 NA | NA |
0.209 NA | NA |
0.396 NA | NA |
0.046 NA | NA |
0.000 NA | NA |
| 1 spectrum, VGVGK | 0.159 | 0.031 | 0.158 | 0.000 | 0.209 | 0.396 | 0.046 | 0.000 |
| Plot | Mito | Lyso or Perox | ER | Golgi | PM | Cytosol | Nucleus | ||||||
| Expt B |
1 peptide |
1 spectrum |
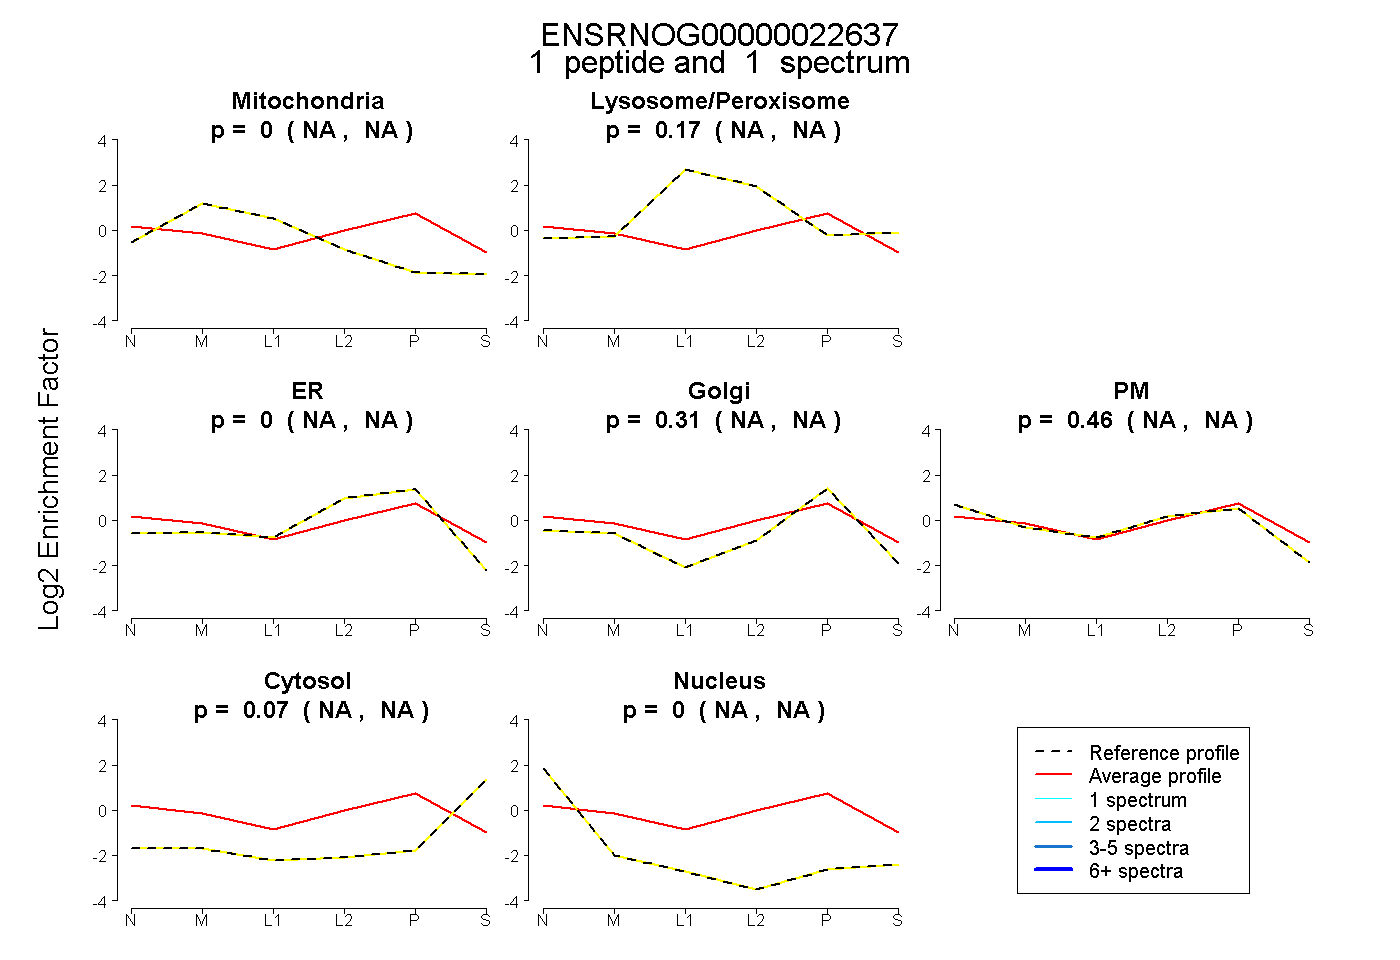 |
0.000 NA | NA |
0.165 NA | NA |
0.000 NA | NA |
0.308 NA | NA |
0.458 NA | NA |
0.070 NA | NA |
0.000 NA | NA |
|||
| Plot | Lyso | Other | |||||||||||
| Expt C |
9 peptides |
27 spectra |
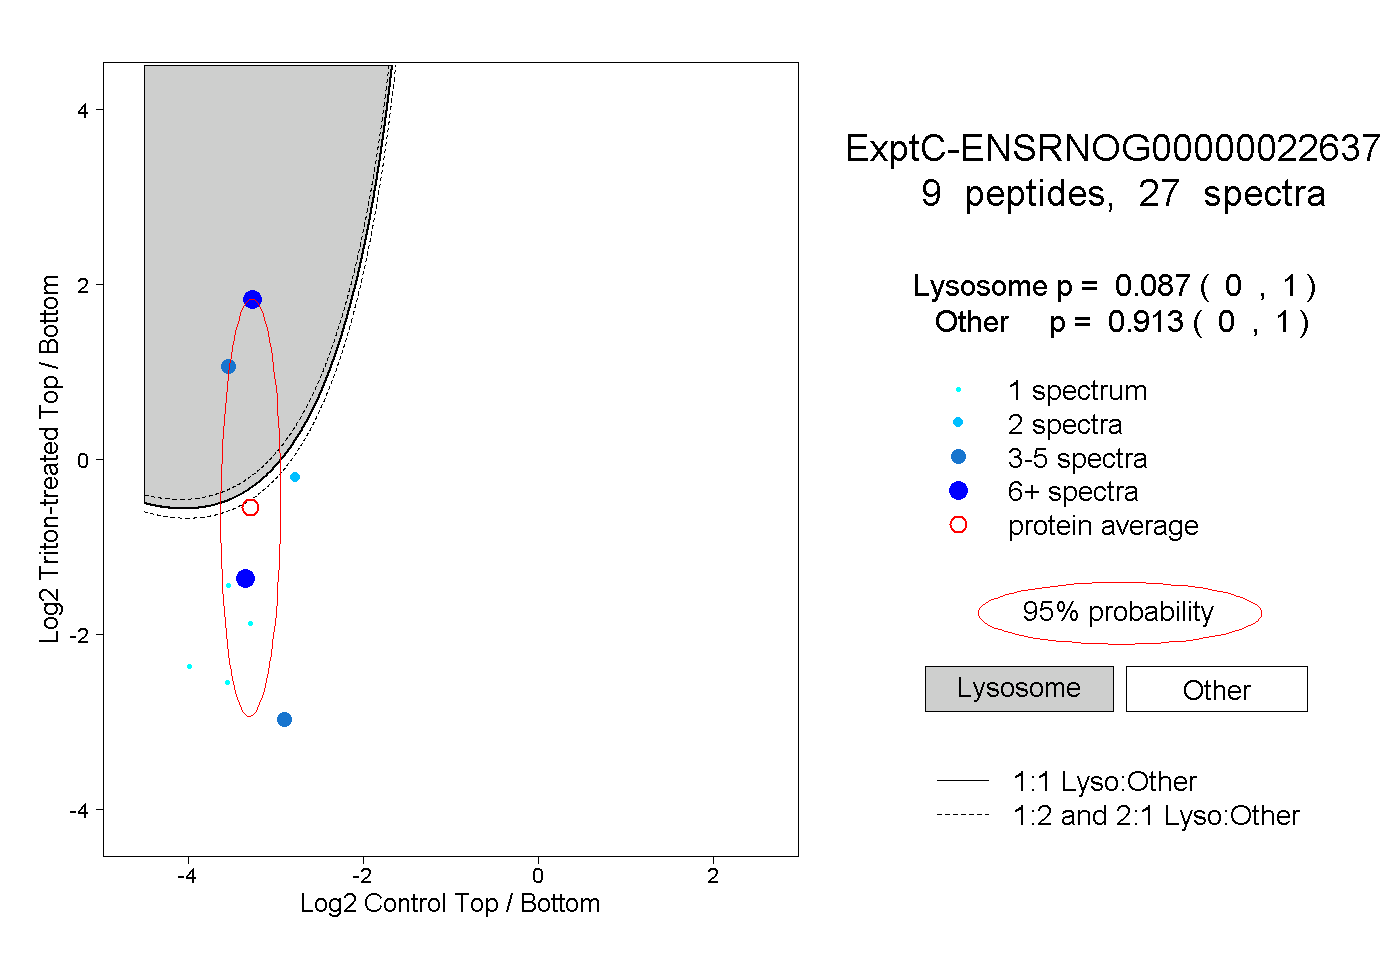 |
0.087 0.000 | 1.000 |
0.913 0.000 | 1.000 |