 7
7peptides
spectra
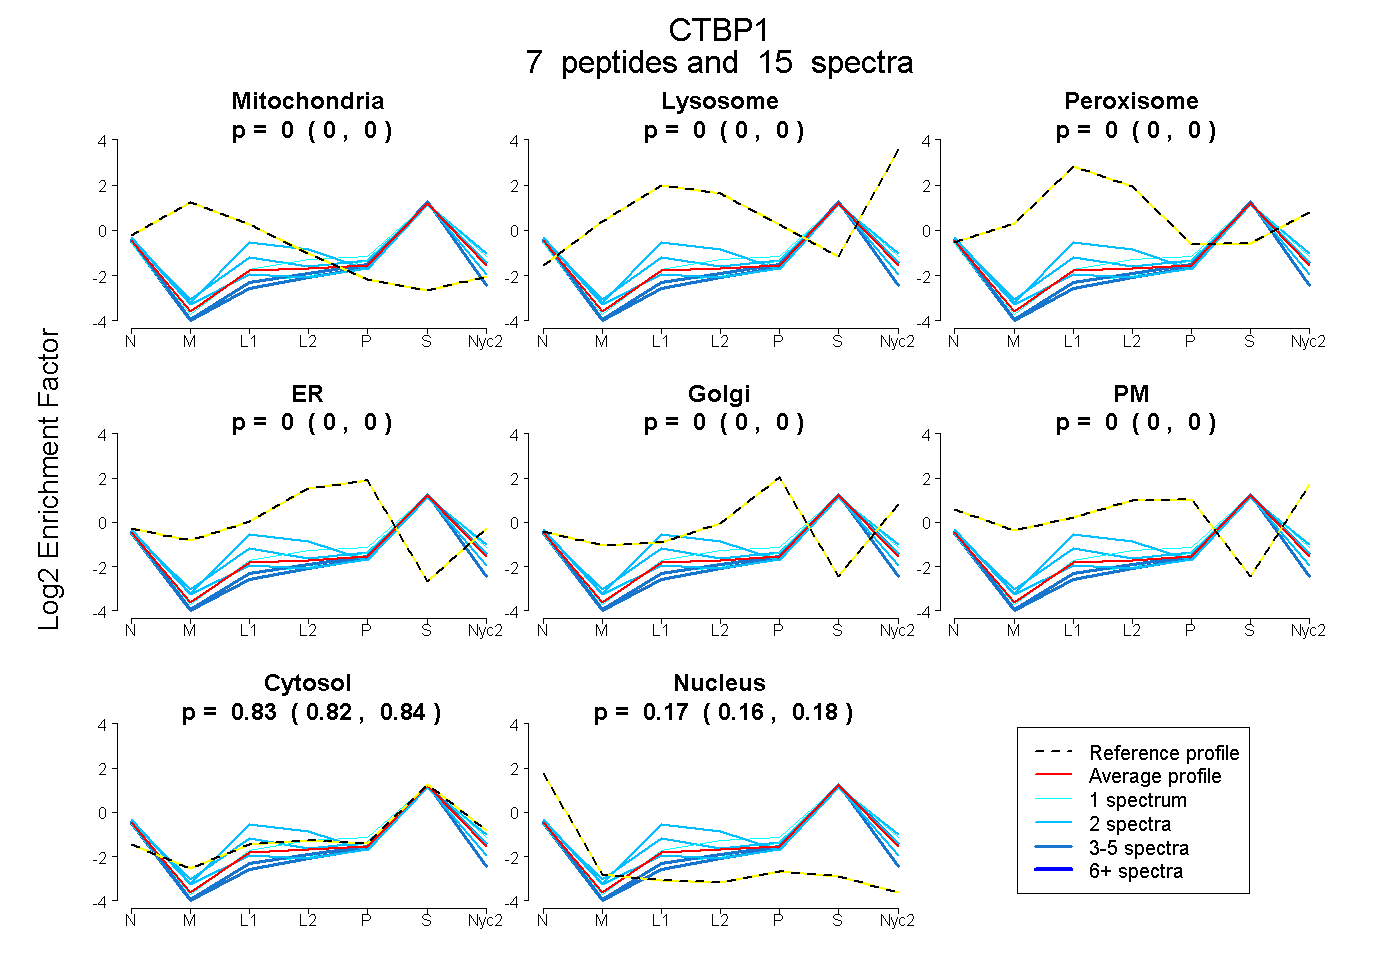
0.000 | 0.000
0.000 | 0.000
0.000 | 0.000
0.000 | 0.000
0.000 | 0.000
0.000 | 0.000
0.823 | 0.840
0.158 | 0.176
4peptides
spectra
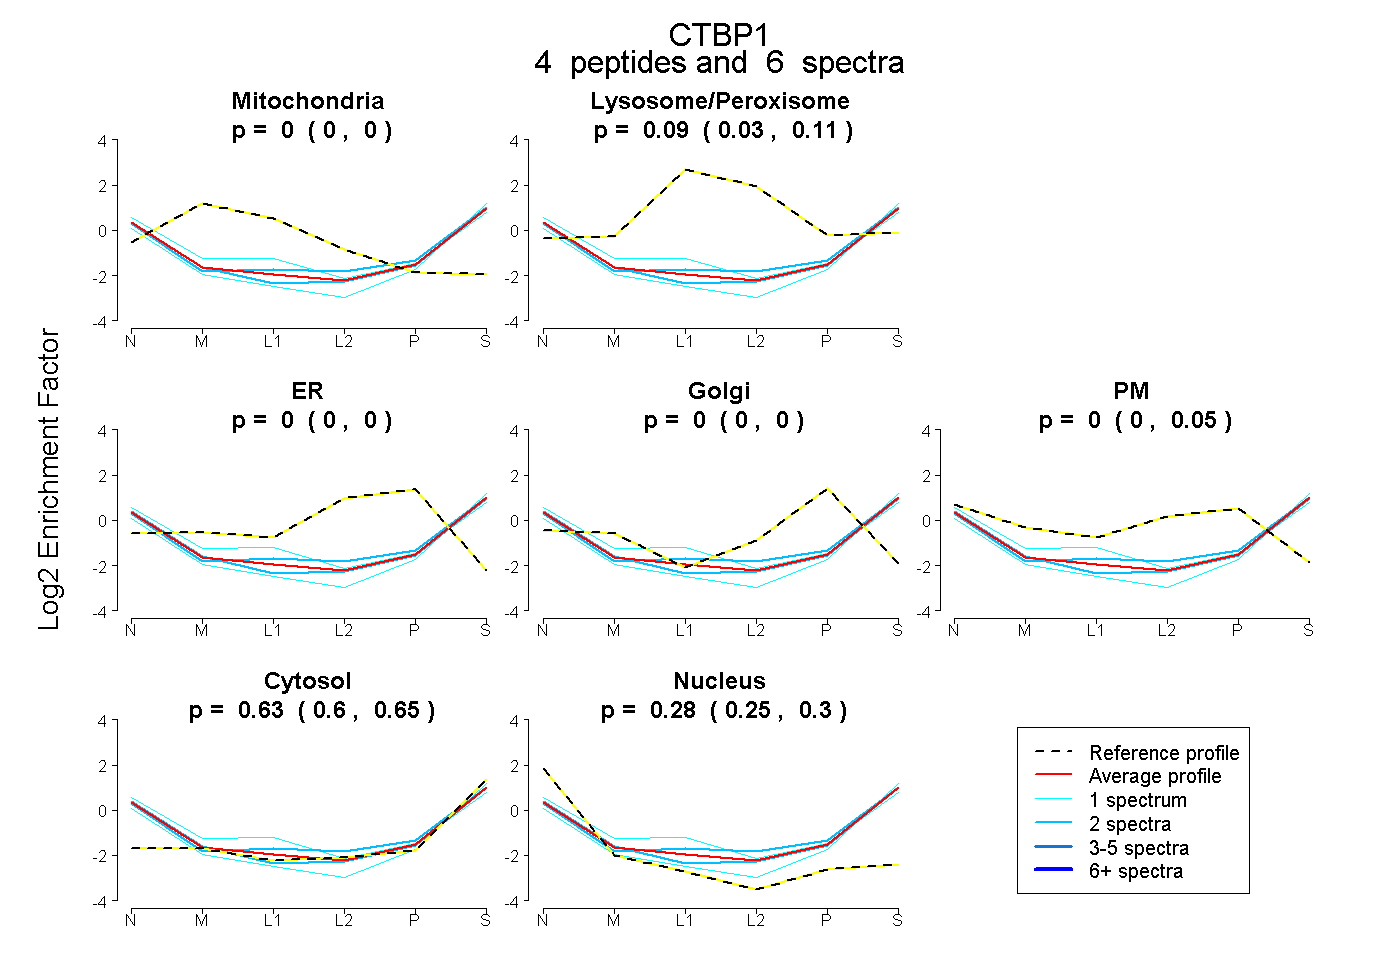
0.000 | 0.000
0.029 | 0.111
0.000 | 0.000
0.000 | 0.000
0.000 | 0.053
0.602 | 0.651
0.252 | 0.296
4peptides
spectra
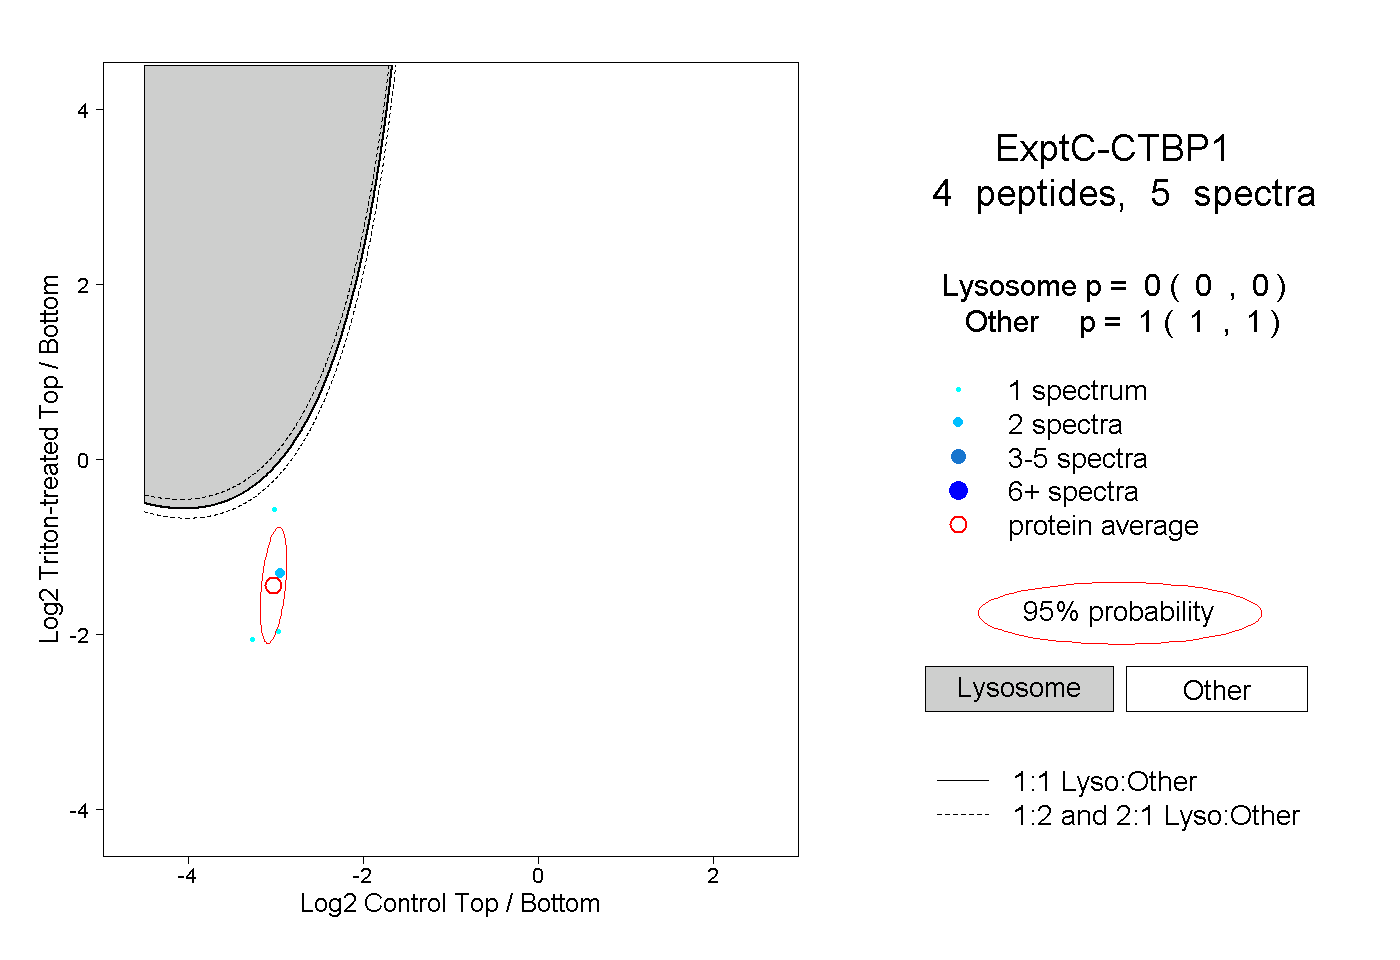
0.000 | 0.000
1.000 | 1.000