 6
6peptides
spectra
0.000 | 0.000
0.000 | 0.000
0.000 | 0.000
0.000 | 0.000
0.000 | 0.000
0.479 | 0.496
0.284 | 0.296
0.211 | 0.228
| Plot | Mito | Lyso | Perox | ER | Golgi | PM | Cytosol | Nucleus | |||||
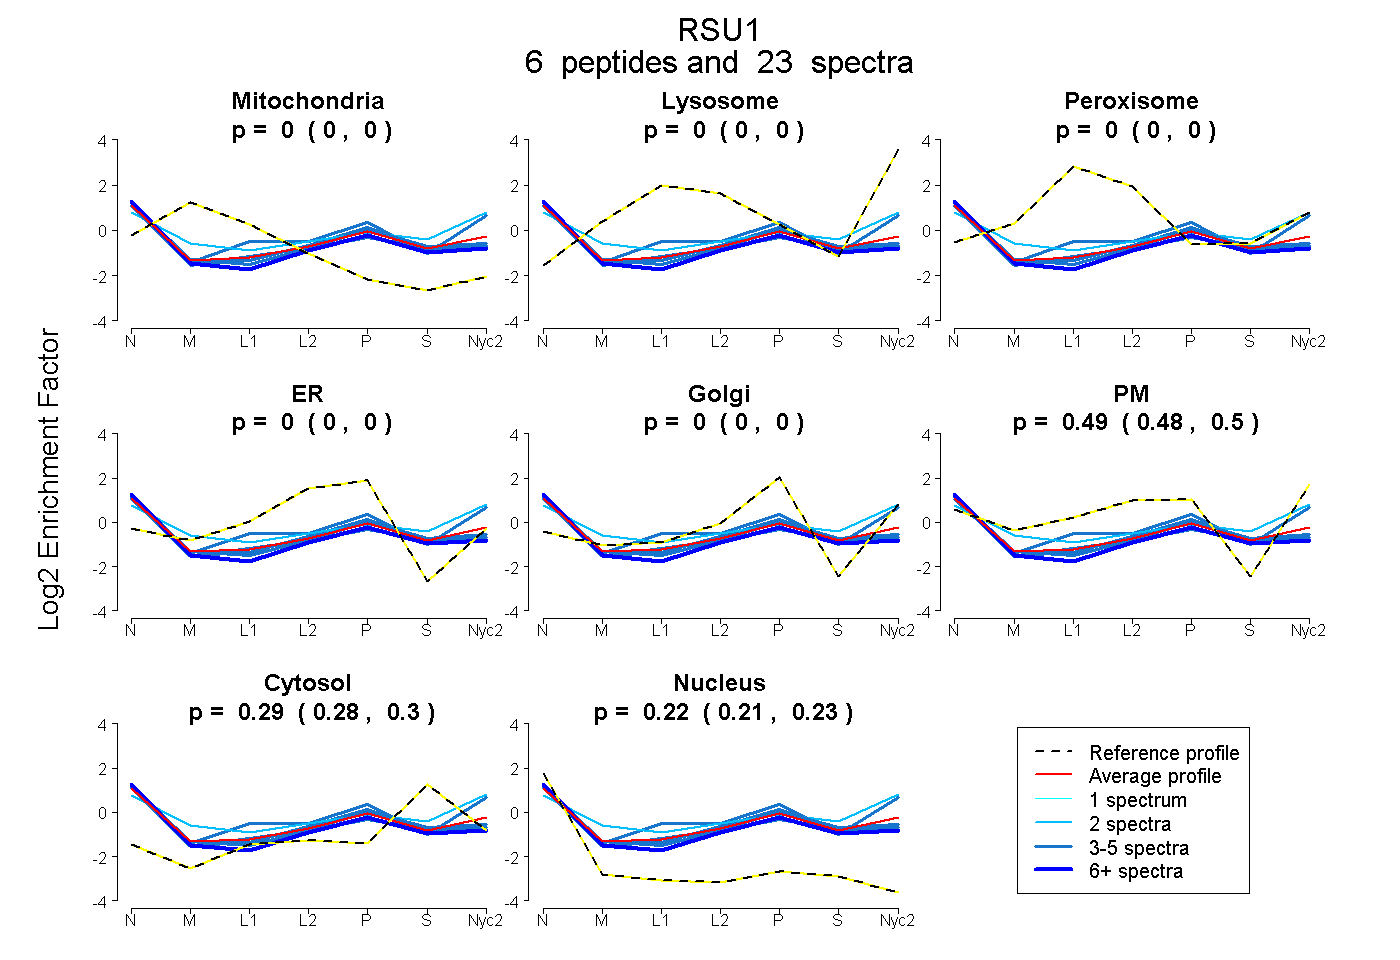
| Expt A |
6 peptides |
23 spectra |
|
0.000 0.000 | 0.000 |
0.000 0.000 | 0.000 |
0.000 0.000 | 0.000 |
0.000 0.000 | 0.000 |
0.000 0.000 | 0.000 |
0.489 0.479 | 0.496 |
0.291 0.284 | 0.296 |
0.221 0.211 | 0.228 |
| 5 spectra, LQILSLR | 0.000 | 0.000 | 0.000 | 0.000 | 0.000 | 0.427 | 0.290 | 0.283 | ||
| 6 spectra, NQPEVDMSDR | 0.000 | 0.000 | 0.000 | 0.000 | 0.038 | 0.386 | 0.251 | 0.325 | ||
| 2 spectra, ELHIQGNR | 0.000 | 0.000 | 0.000 | 0.000 | 0.000 | 0.573 | 0.370 | 0.057 | ||
| 4 spectra, IVEESR | 0.000 | 0.000 | 0.000 | 0.000 | 0.020 | 0.435 | 0.308 | 0.238 | ||
| 3 spectra, DNDLISLPK | 0.000 | 0.000 | 0.000 | 0.000 | 0.000 | 0.628 | 0.255 | 0.117 | ||
| 3 spectra, EIGELTQLK | 0.000 | 0.000 | 0.000 | 0.051 | 0.042 | 0.382 | 0.276 | 0.249 |
| Plot | Mito | Lyso or Perox | ER | Golgi | PM | Cytosol | Nucleus | ||||||
| Expt B |
3 peptides |
6 spectra |
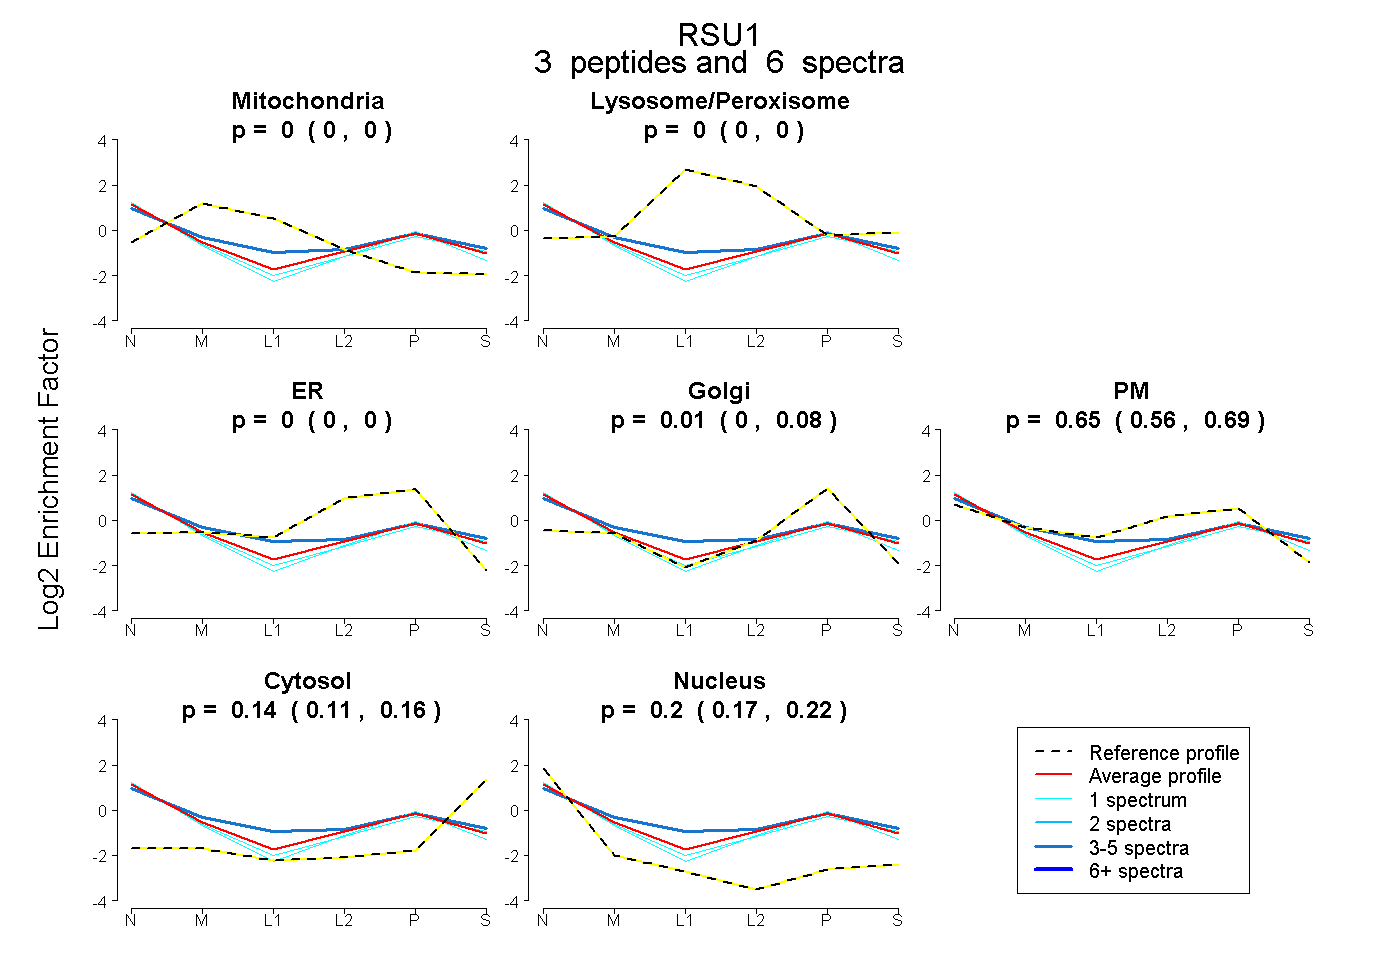 |
0.000 0.000 | 0.000 |
0.000 0.000 | 0.000 |
0.000 0.000 | 0.000 |
0.012 0.000 | 0.085 |
0.654 0.558 | 0.687 |
0.140 0.115 | 0.157 |
0.195 0.171 | 0.216 |
|||
| Plot | Lyso | Other | |||||||||||
| Expt C |
7 peptides |
31 spectra |
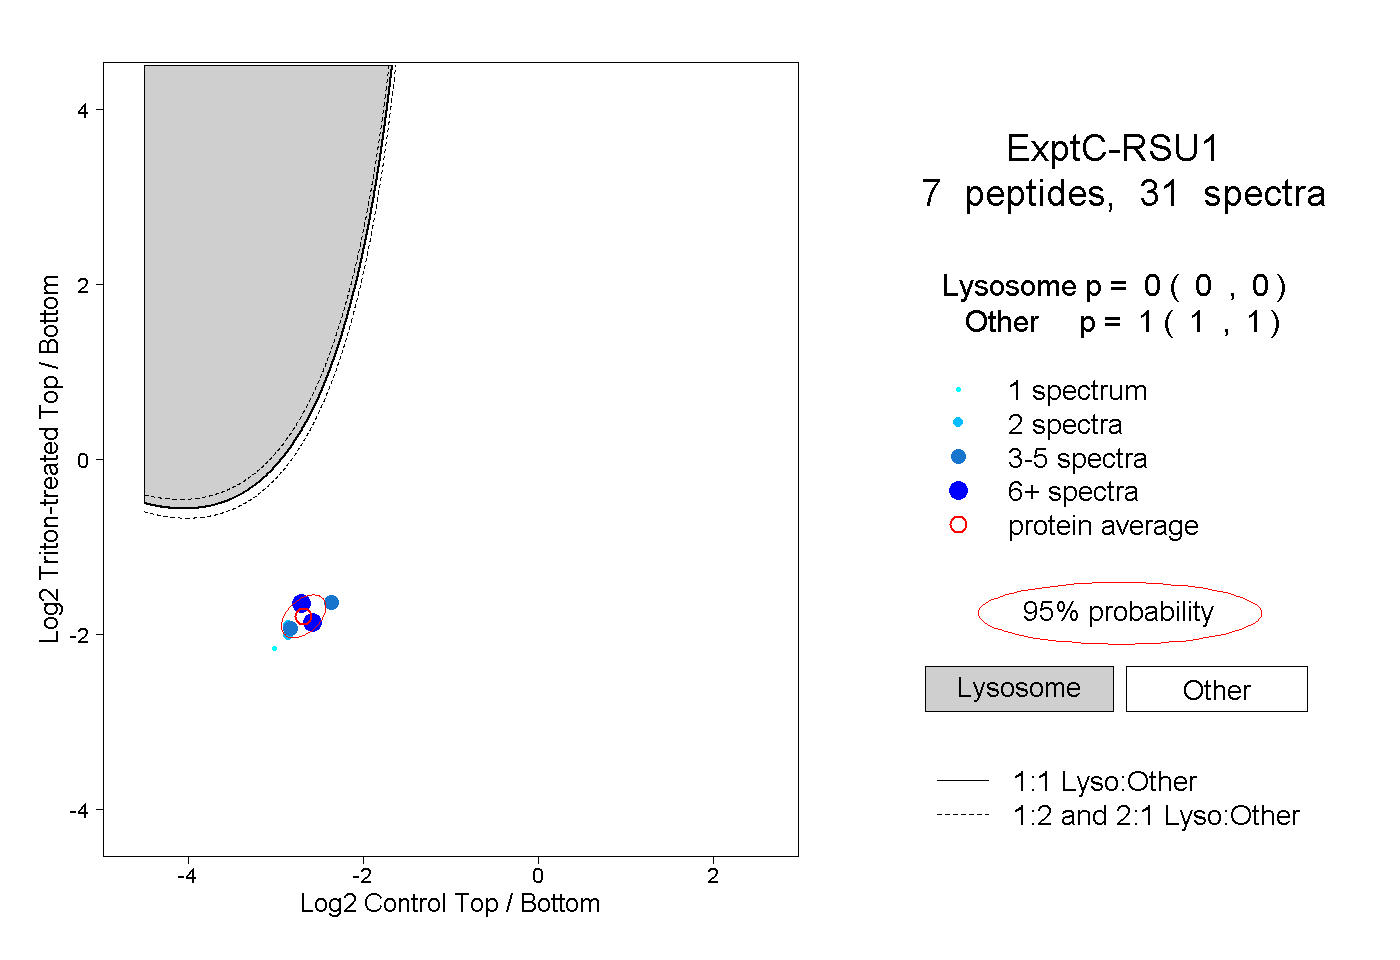 |
0.000 0.000 | 0.000 |
1.000 1.000 | 1.000 |
||||||||
| Plot | Lyso | Other | |||||||||||
| Expt D |
1 peptide |
1 spectrum |
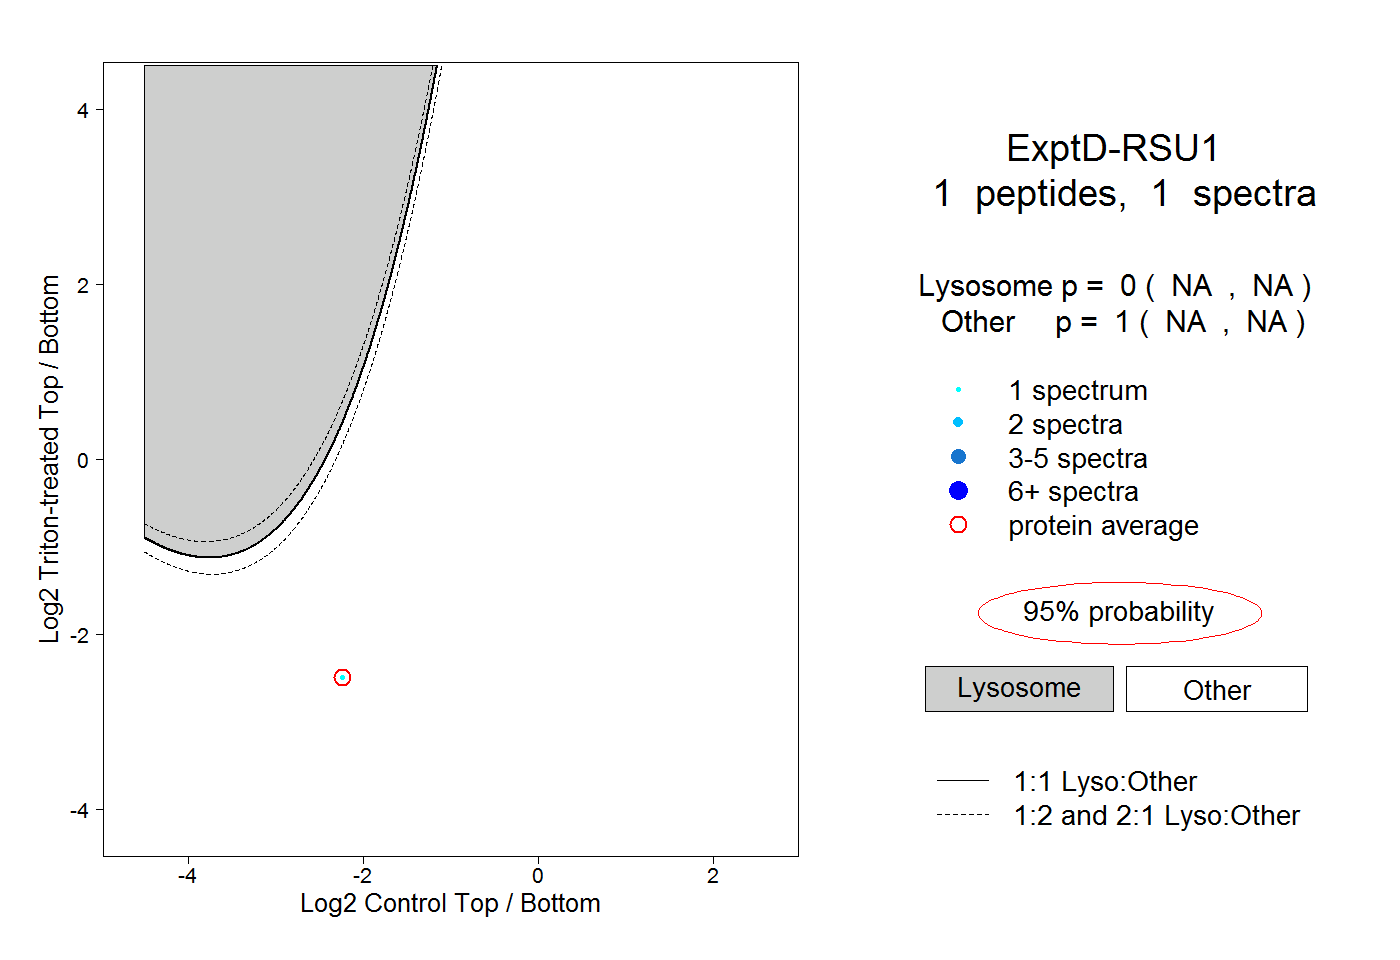 |
0.000 NA | NA |
1.000 NA | NA |