 5
5peptides
spectra

0.678 | 0.778
0.000 | 0.000
0.006 | 0.092
0.000 | 0.119
0.000 | 0.025
0.000 | 0.000
0.141 | 0.175
0.000 | 0.000
1peptide
spectrum
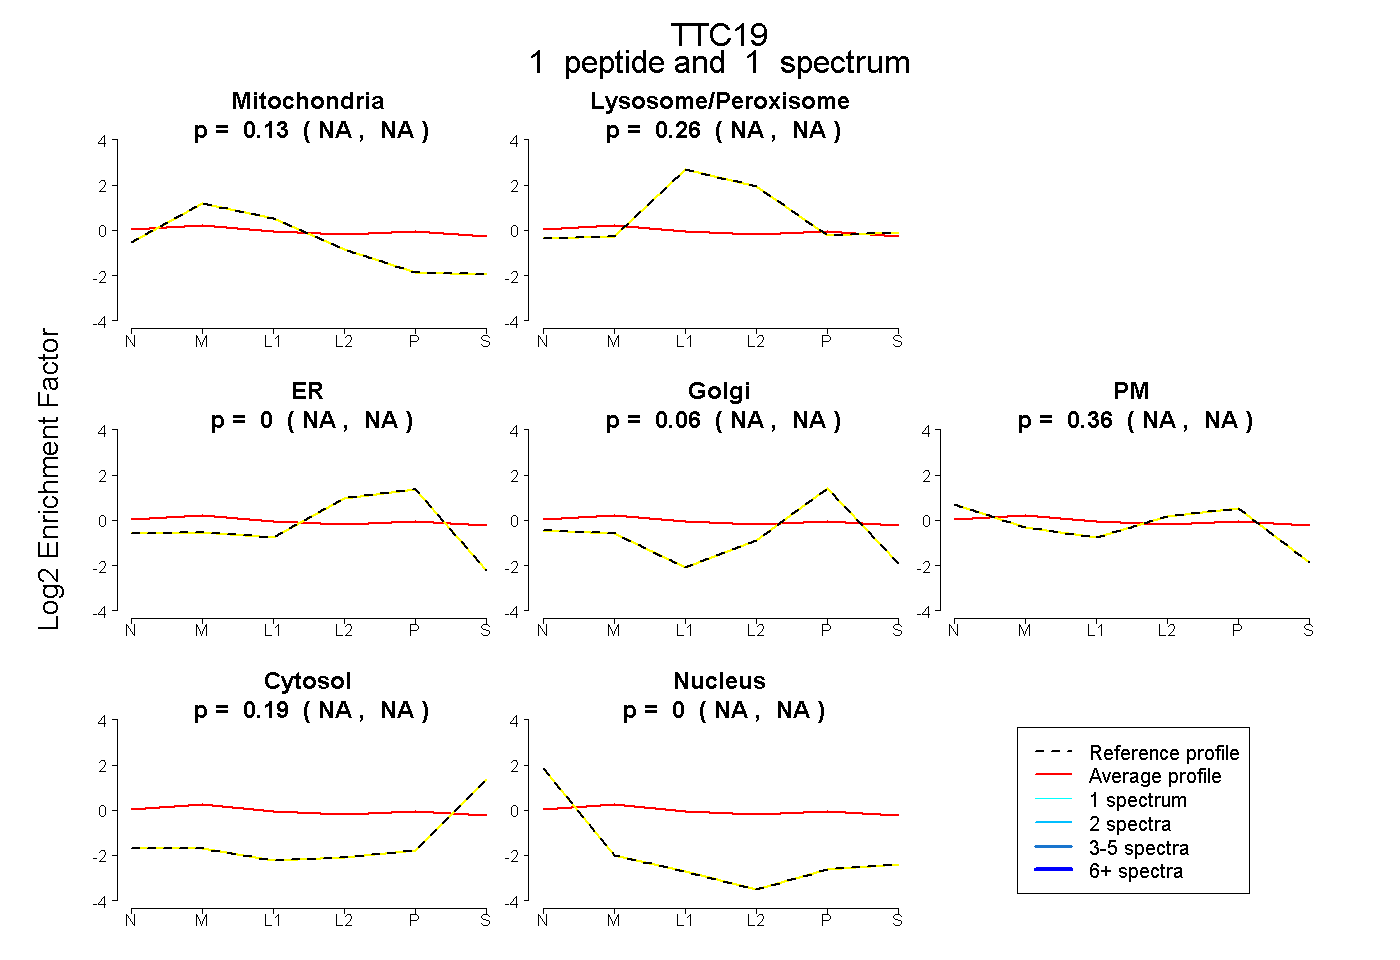
NA | NA
NA | NA
NA | NA
NA | NA
NA | NA
NA | NA
NA | NA
7peptides
spectra

0.000 | 0.000
1.000 | 1.000
1peptide
spectra
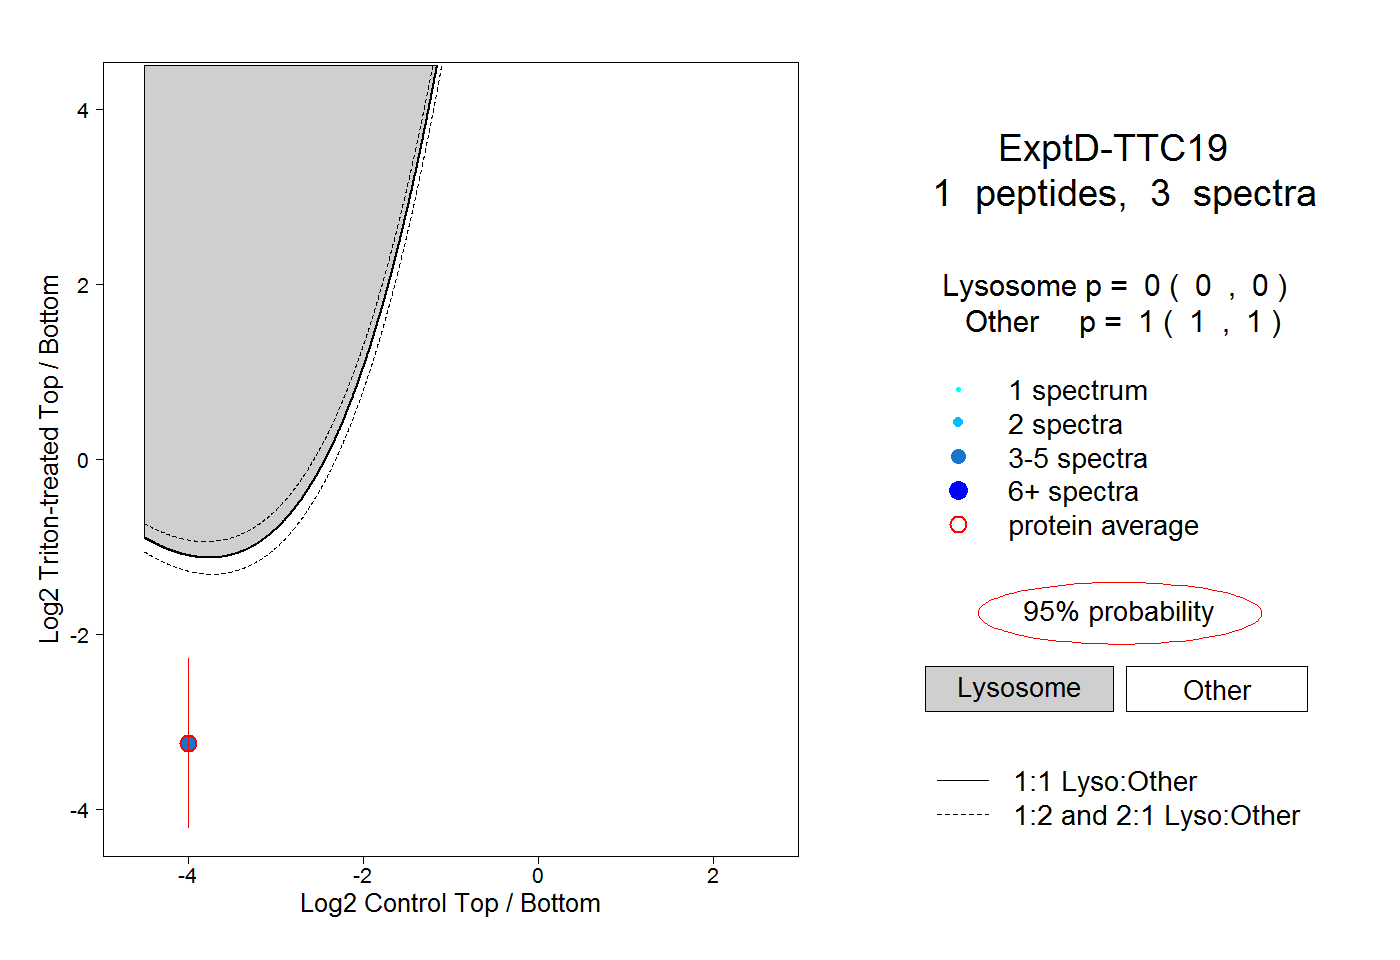
0.000 | 0.000
1.000 | 1.000