 1
1peptide
spectra
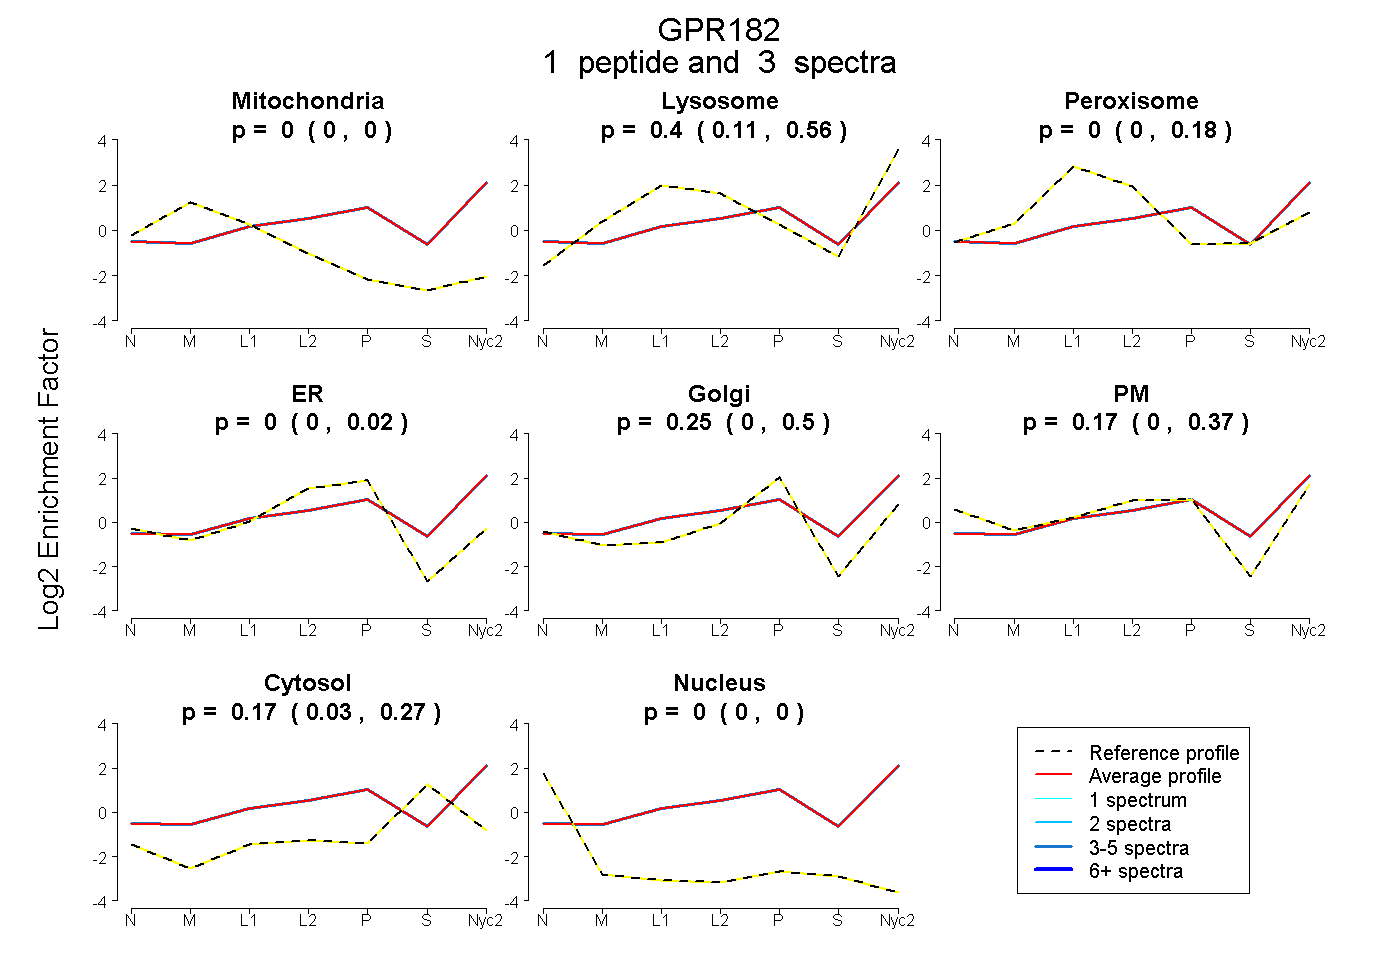
0.000 | 0.000
0.105 | 0.564
0.000 | 0.179
0.000 | 0.018
0.000 | 0.495
0.000 | 0.373
0.027 | 0.274
0.000 | 0.000
2peptides
spectra
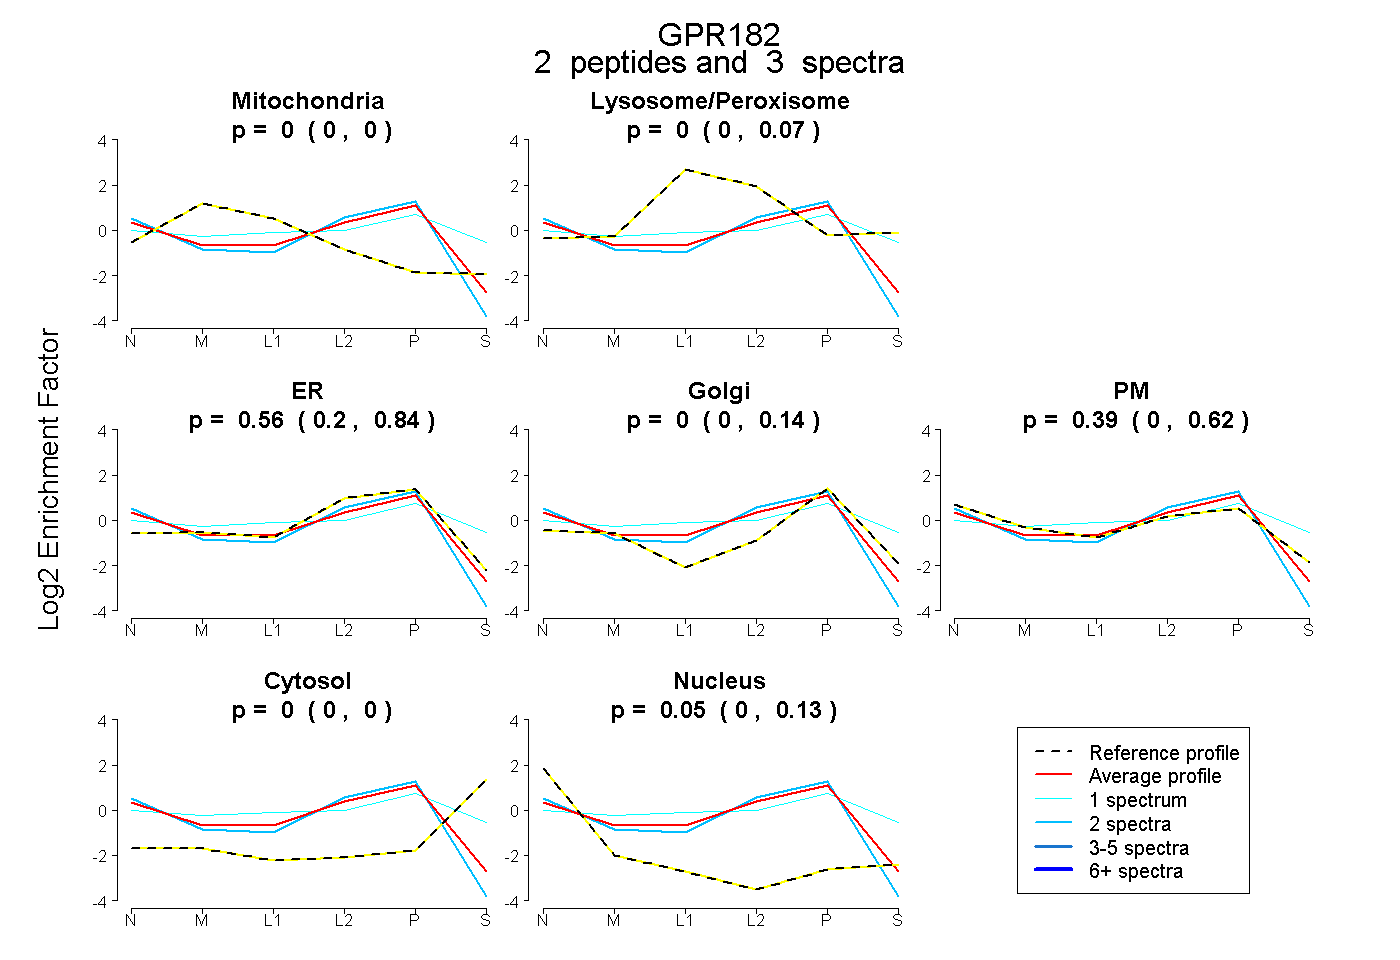
0.000 | 0.000
0.000 | 0.066
0.196 | 0.835
0.000 | 0.138
0.000 | 0.615
0.000 | 0.000
0.000 | 0.131
3peptides
spectra
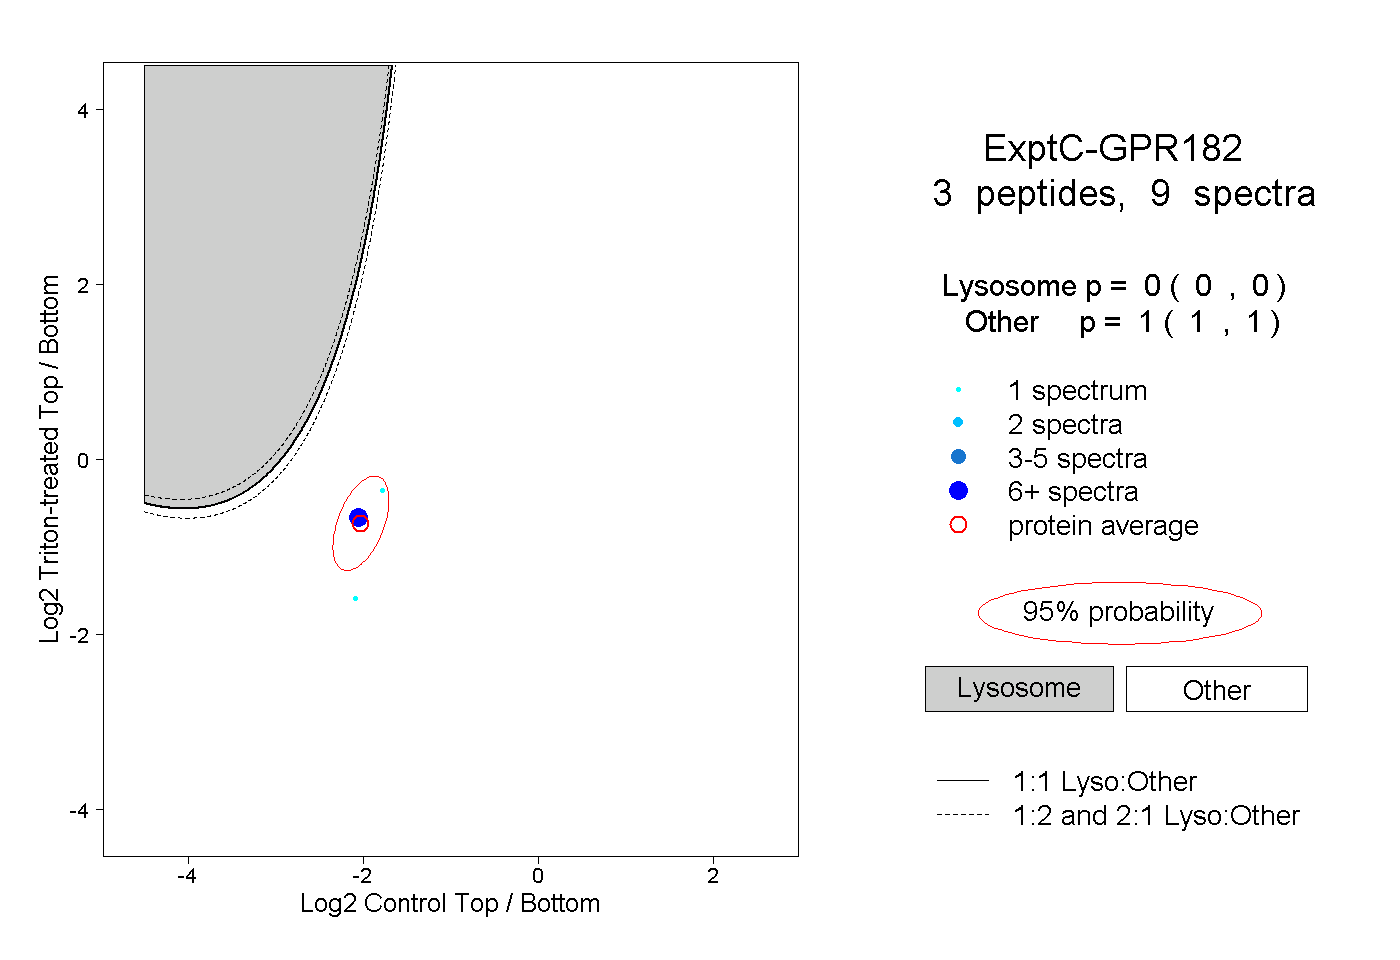
0.000 | 0.000
1.000 | 1.000