59
59peptides
spectra

0.000 | 0.000
0.368 | 0.372
0.000 | 0.000
0.000 | 0.000
0.000 | 0.000
0.005 | 0.010
0.621 | 0.623
0.000 | 0.000
13peptides
spectra
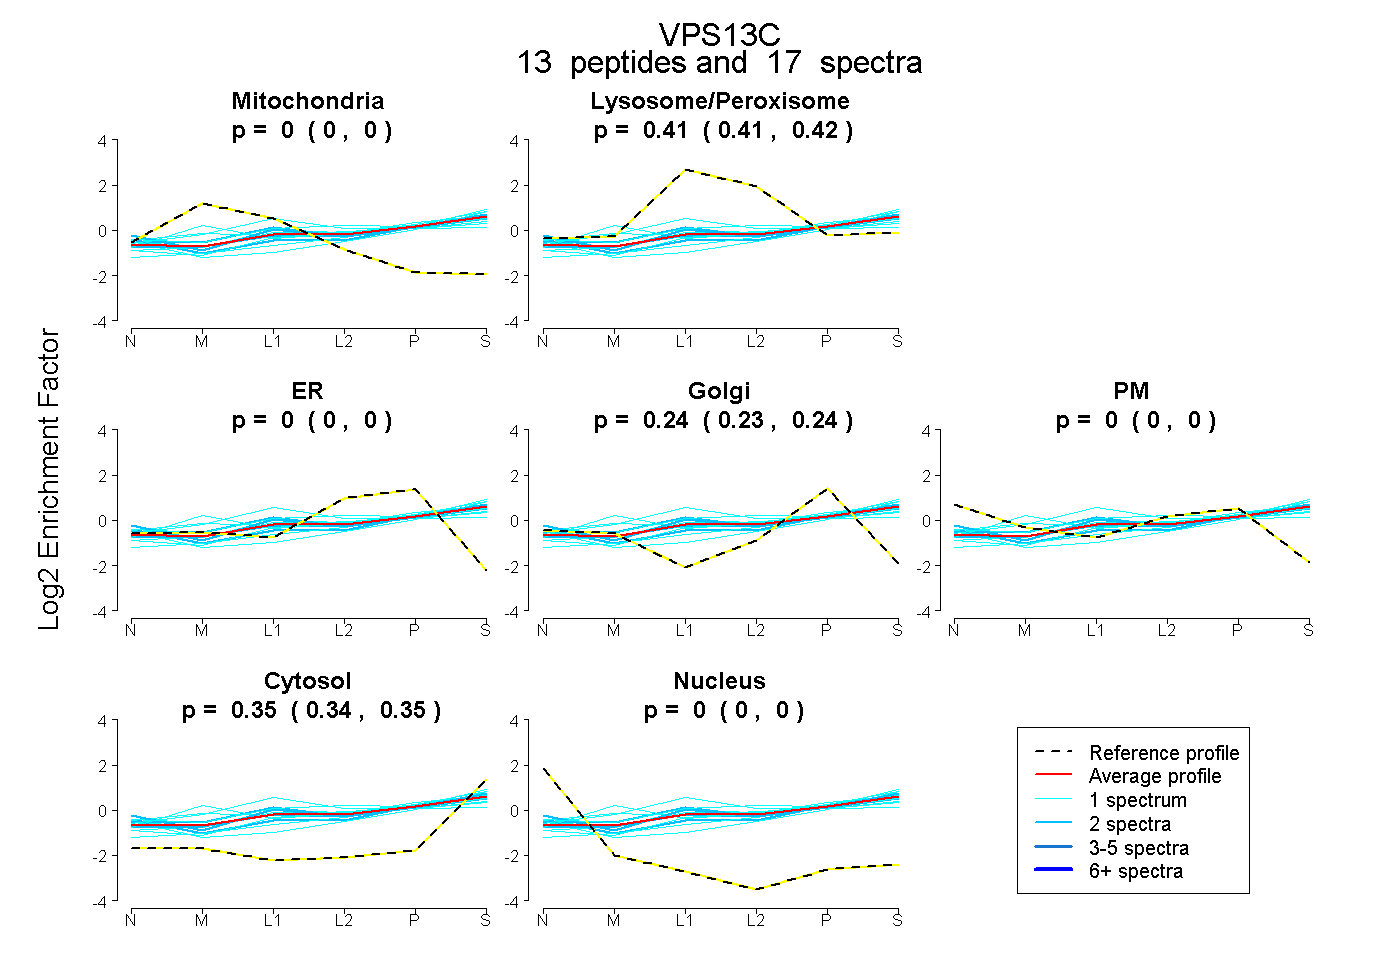
0.000 | 0.000
0.406 | 0.419
0.000 | 0.000
0.231 | 0.244
0.000 | 0.000
0.344 | 0.354
0.000 | 0.000