 7
7peptides
spectra
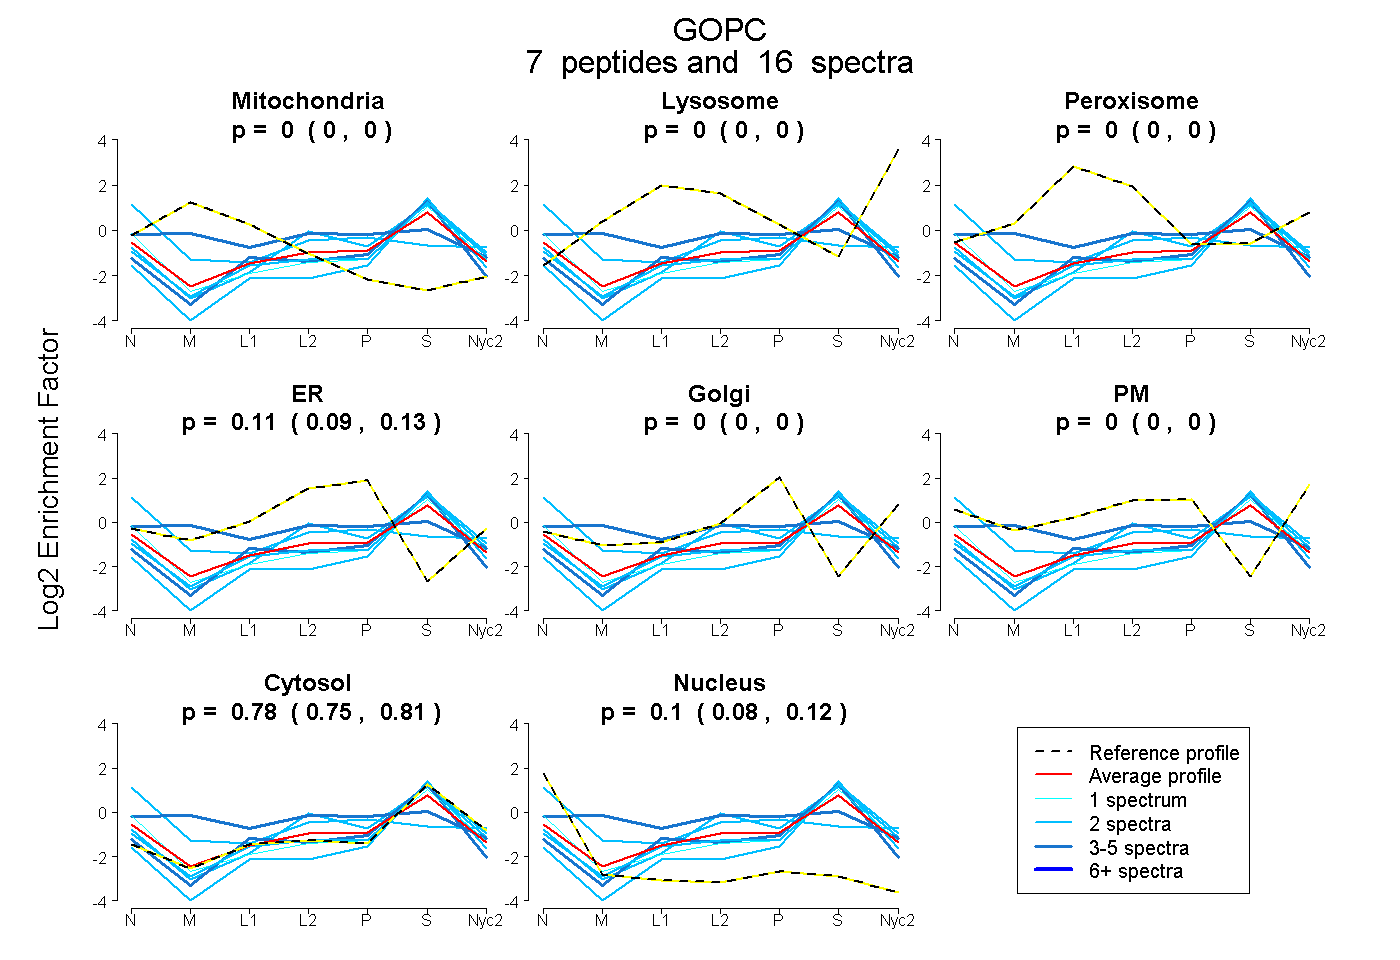
0.000 | 0.000
0.000 | 0.000
0.000 | 0.001
0.089 | 0.130
0.000 | 0.000
0.000 | 0.000
0.752 | 0.813
0.082 | 0.123
1peptide
spectrum
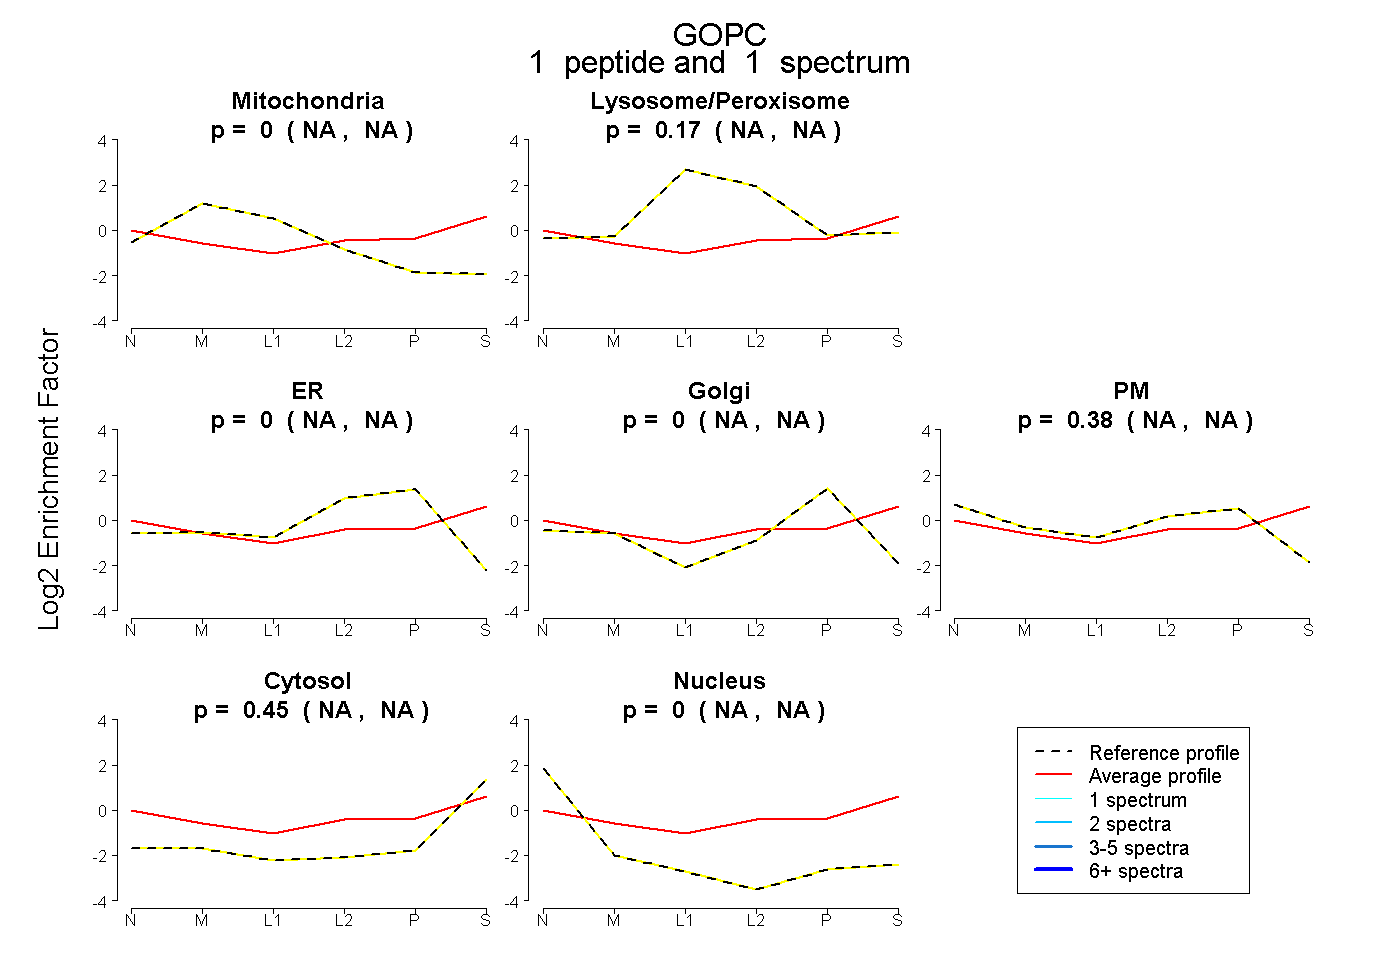
NA | NA
NA | NA
NA | NA
NA | NA
NA | NA
NA | NA
NA | NA
2peptides
spectra
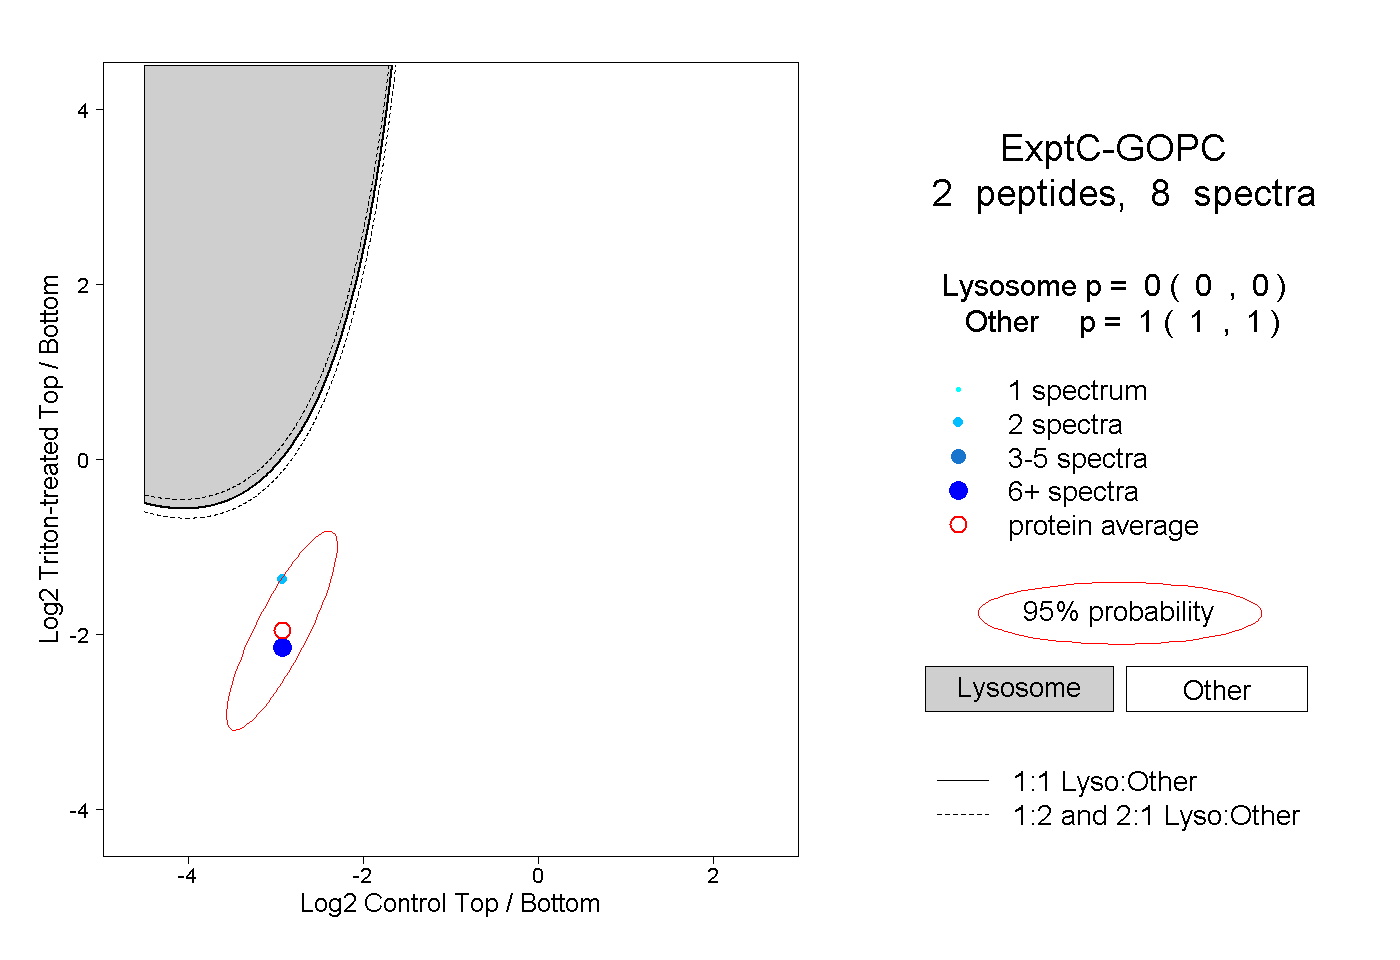
0.000 | 0.000
1.000 | 1.000
1peptide
spectra
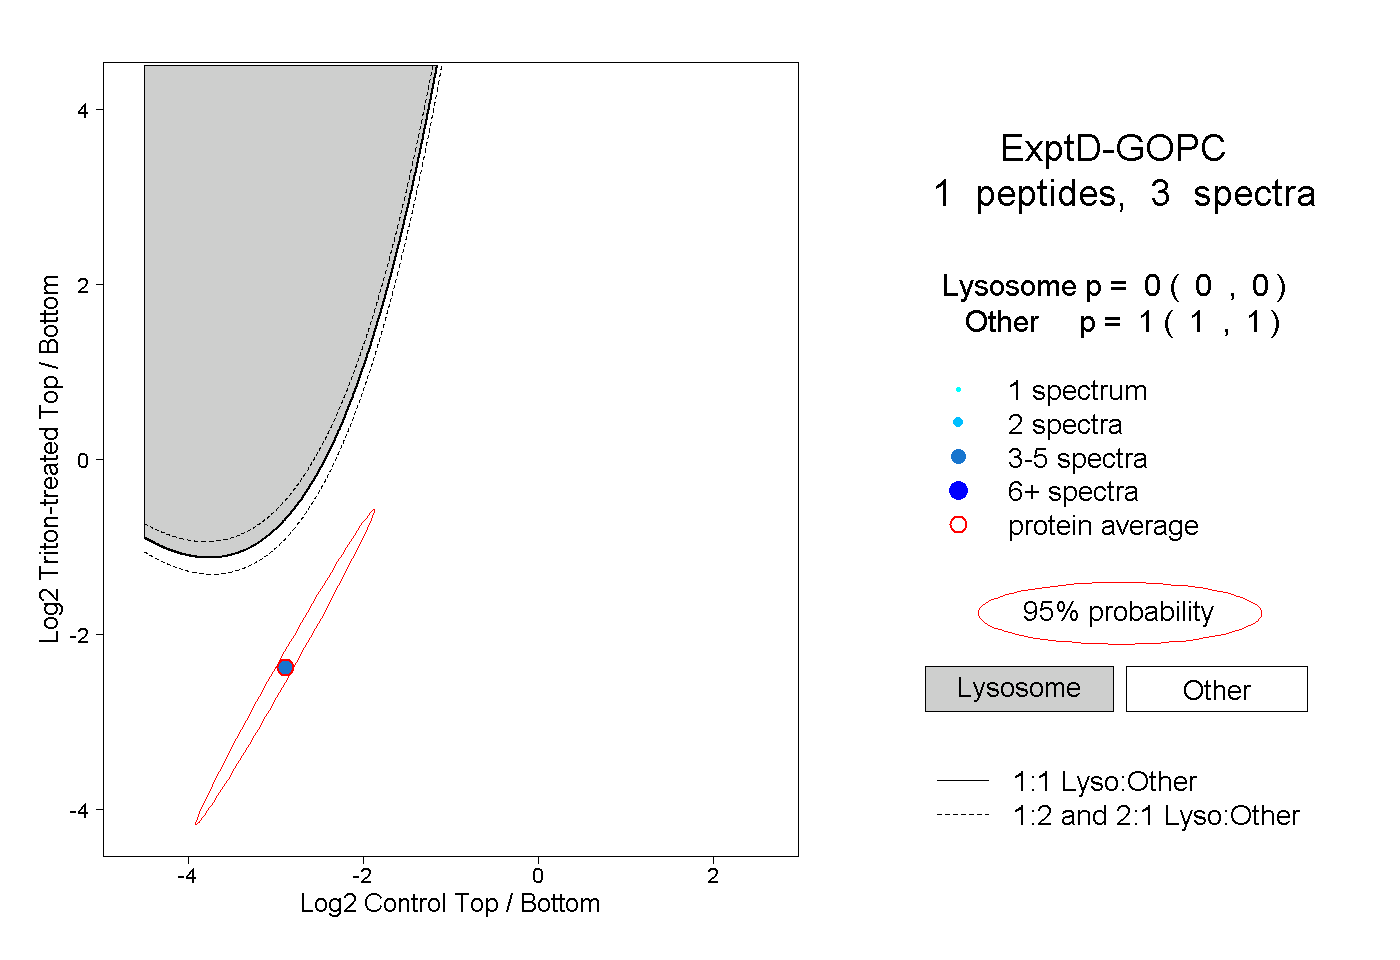
0.000 | 0.000
1.000 | 1.000