 35
35peptides
spectra
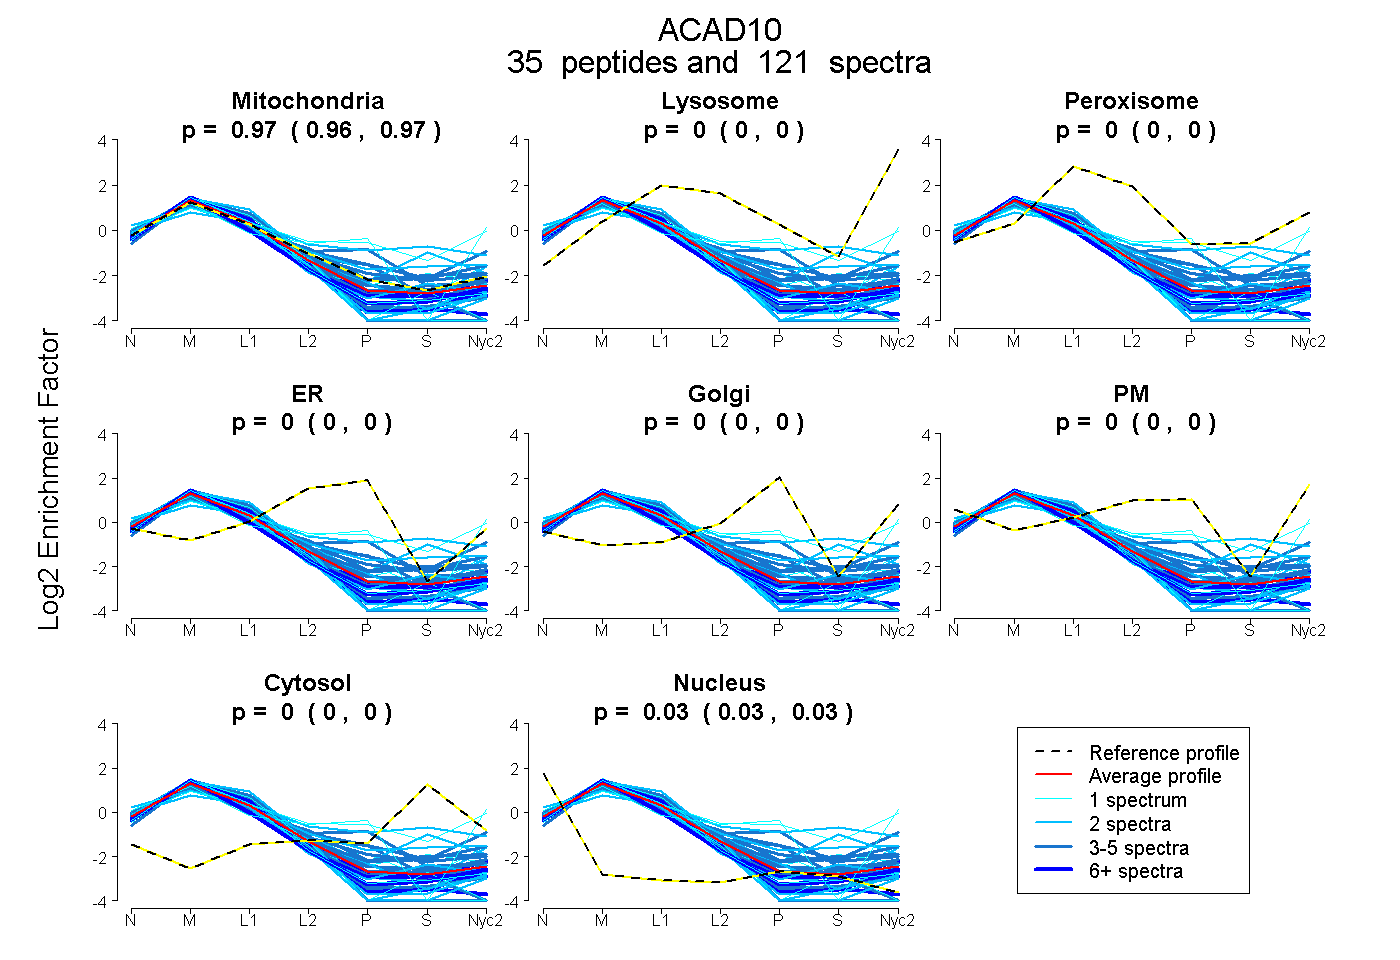
0.965 | 0.968
0.000 | 0.000
0.000 | 0.000
0.000 | 0.000
0.000 | 0.000
0.000 | 0.000
0.000 | 0.000
0.032 | 0.035
26peptides
spectra
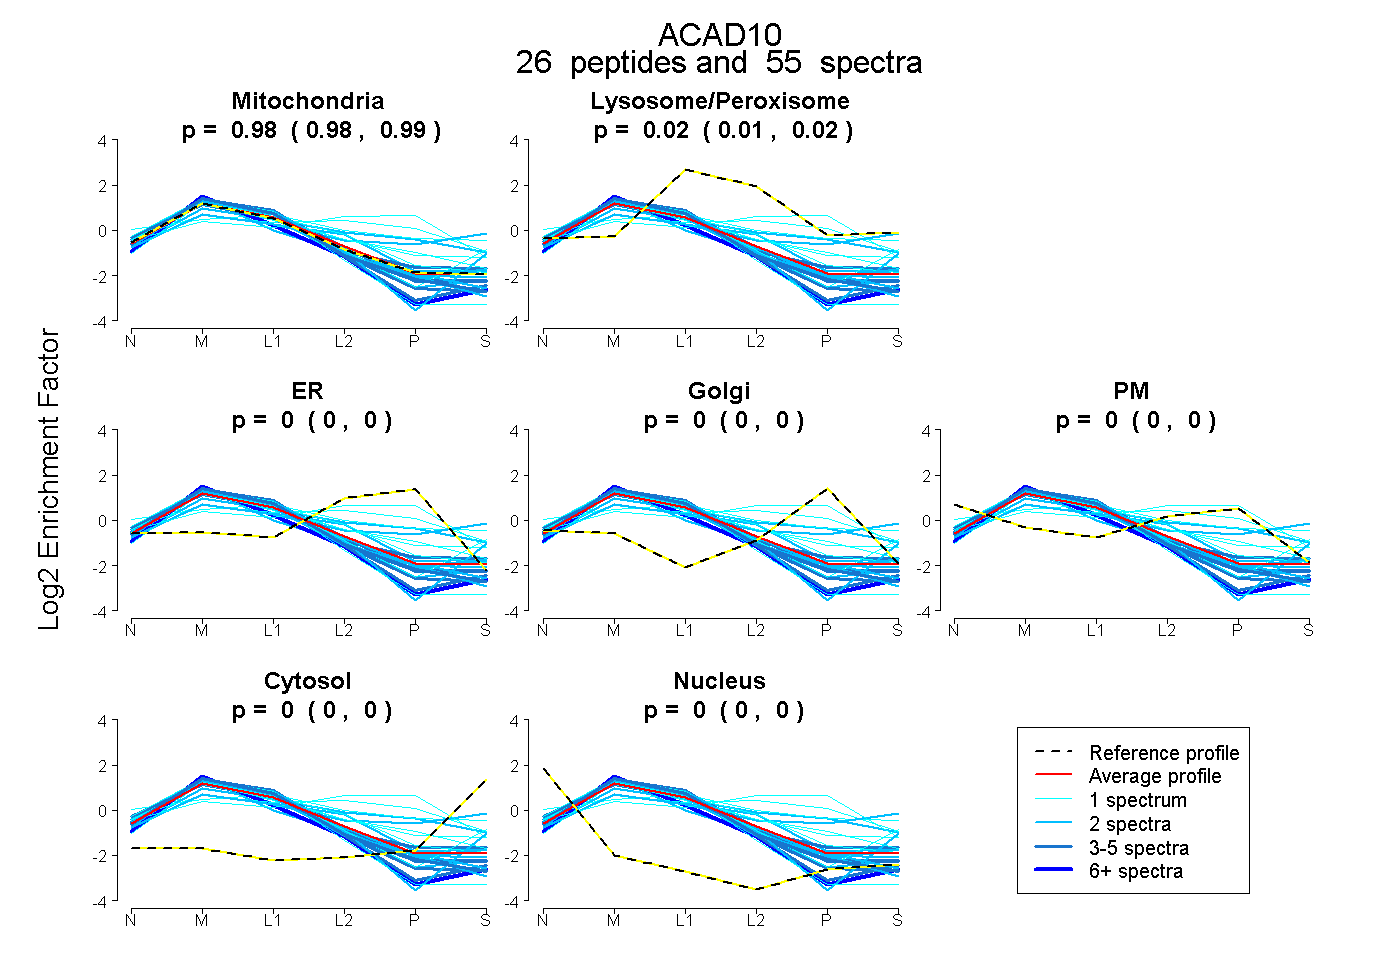
0.975 | 0.988
0.011 | 0.023
0.000 | 0.002
0.000 | 0.000
0.000 | 0.000
0.000 | 0.000
0.000 | 0.000
50peptides
spectra
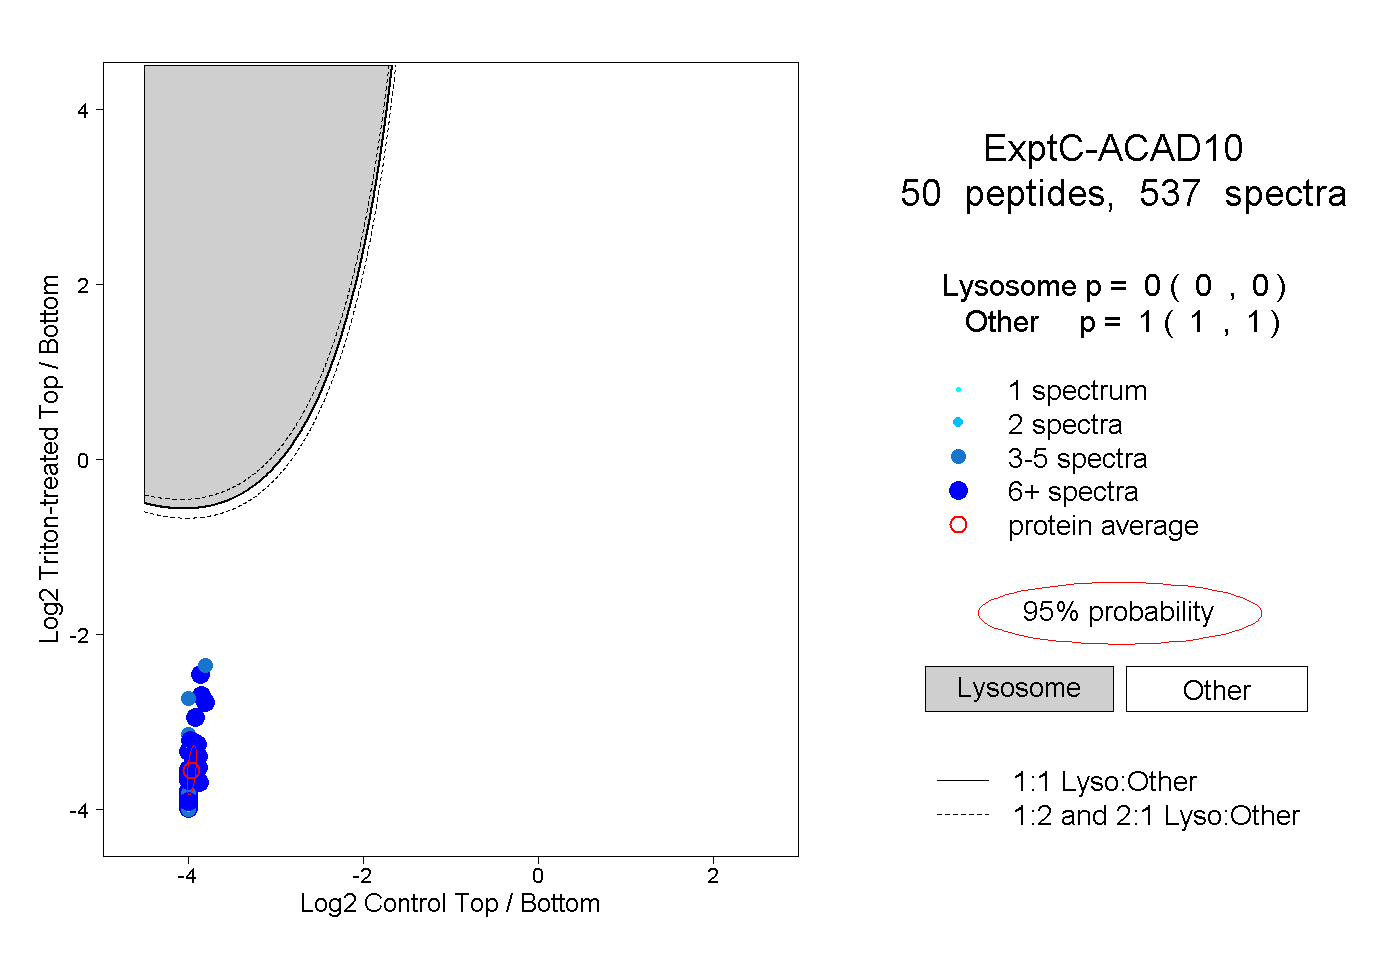
0.000 | 0.000
1.000 | 1.000
18peptides
spectra
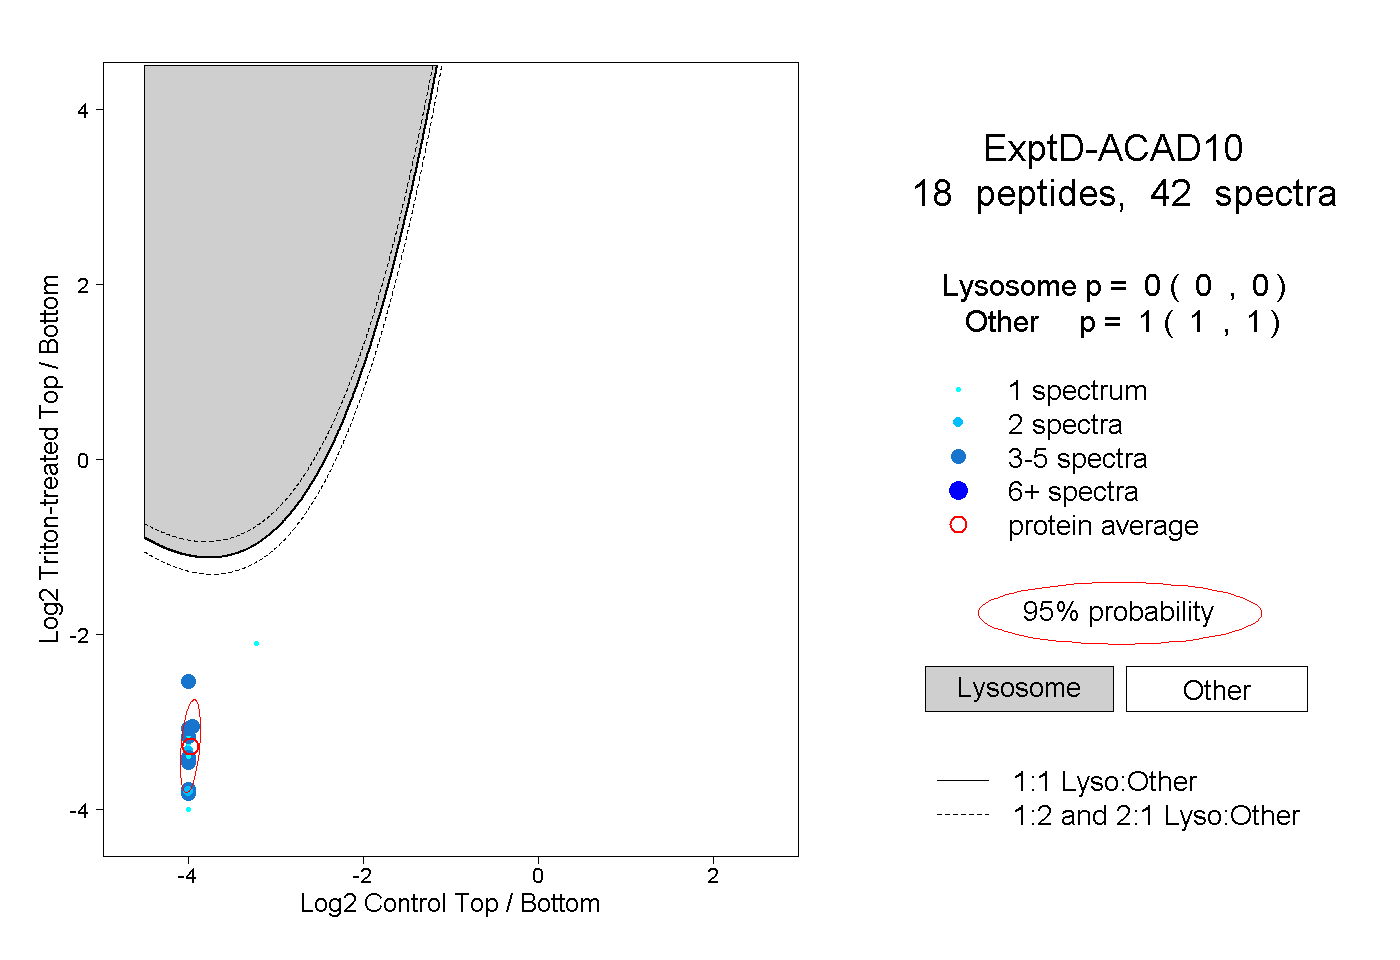
0.000 | 0.000
1.000 | 1.000