| 2 spectra, ELEDLLGFPLHGGVPNTRPVR |
0.381 |
|
0.295 |
|
0.000 |
0.115 |
0.000 |
0.210 |
0.000 |
|
| 2 spectra, VAAILQGVYK |
0.933 |
|
0.000 |
|
0.000 |
0.000 |
0.000 |
0.067 |
0.000 |
|
| 4 spectra, FLEEFGR |
1.000 |
|
0.000 |
|
0.000 |
0.000 |
0.000 |
0.000 |
0.000 |
|
| 1 spectrum, VDNPETAVK |
0.841 |
|
0.049 |
|
0.000 |
0.000 |
0.000 |
0.110 |
0.000 |
|
| 1 spectrum, GGLIISPEGLSPR |
0.142 |
|
0.324 |
|
0.275 |
0.259 |
0.000 |
0.000 |
0.000 |
|
| 1 spectrum, VAASLGIR |
0.941 |
|
0.000 |
|
0.000 |
0.000 |
0.000 |
0.000 |
0.059 |
|
| 2 spectra, ALELMK |
0.895 |
|
0.049 |
|
0.056 |
0.000 |
0.000 |
0.000 |
0.000 |
|
| 1 spectrum, VASALVAR |
0.726 |
|
0.112 |
|
0.062 |
0.057 |
0.042 |
0.000 |
0.000 |
|
| 3 spectra, LQEPAAPR |
0.906 |
|
0.034 |
|
0.000 |
0.000 |
0.030 |
0.014 |
0.017 |
|
| 2 spectra, LLQFDHGQSNPTYYIR |
1.000 |
|
0.000 |
|
0.000 |
0.000 |
0.000 |
0.000 |
0.000 |
|
| 3 spectra, WLAPLLEGR |
1.000 |
|
0.000 |
|
0.000 |
0.000 |
0.000 |
0.000 |
0.000 |
|
| 1 spectrum, EAIYTAMNQVLCR |
0.263 |
|
0.383 |
|
0.000 |
0.289 |
0.065 |
0.000 |
0.000 |
|
| 2 spectra, AAETSSIPAMER |
0.965 |
|
0.000 |
|
0.000 |
0.000 |
0.000 |
0.000 |
0.035 |
|
| 2 spectra, TDPQAPR |
1.000 |
|
0.000 |
|
0.000 |
0.000 |
0.000 |
0.000 |
0.000 |
|
| 1 spectrum, QFPVMTQAVSQIR |
0.717 |
|
0.137 |
|
0.049 |
0.032 |
0.000 |
0.065 |
0.000 |
|
| 2 spectra, AAHLMDVAGNK |
0.480 |
|
0.283 |
|
0.000 |
0.221 |
0.000 |
0.016 |
0.000 |
|
| 2 spectra, AAALEIAMIK |
0.959 |
|
0.000 |
|
0.000 |
0.000 |
0.000 |
0.041 |
0.000 |
|
| 1 spectrum, AEGLQTAVLTNNFLLSNGK |
0.274 |
|
0.354 |
|
0.000 |
0.000 |
0.263 |
0.108 |
0.000 |
|
| 2 spectra, VIRPLSVFGLEDPPGGHGEVQFK |
0.976 |
|
0.024 |
|
0.000 |
0.000 |
0.000 |
0.000 |
0.000 |
|
| 3 spectra, ENILLGPGR |
1.000 |
|
0.000 |
|
0.000 |
0.000 |
0.000 |
0.000 |
0.000 |
|
| 2 spectra, LIGYSER |
0.969 |
|
0.000 |
|
0.000 |
0.000 |
0.000 |
0.000 |
0.031 |
|
| 6 spectra, AMPATTTLTR |
0.961 |
|
0.000 |
|
0.000 |
0.000 |
0.000 |
0.000 |
0.039 |
|
| 3 spectra, GFEIAQGR |
1.000 |
|
0.000 |
|
0.000 |
0.000 |
0.000 |
0.000 |
0.000 |
|
| 1 spectrum, TTVVHGDFR |
0.852 |
|
0.095 |
|
0.053 |
0.000 |
0.000 |
0.000 |
0.000 |
|
| 3 spectra, IFQLCLQR |
0.954 |
|
0.000 |
|
0.000 |
0.000 |
0.000 |
0.000 |
0.046 |
|
| 2 spectra, SFLPLDR |
0.998 |
|
0.000 |
|
0.000 |
0.000 |
0.000 |
0.000 |
0.002 |
|
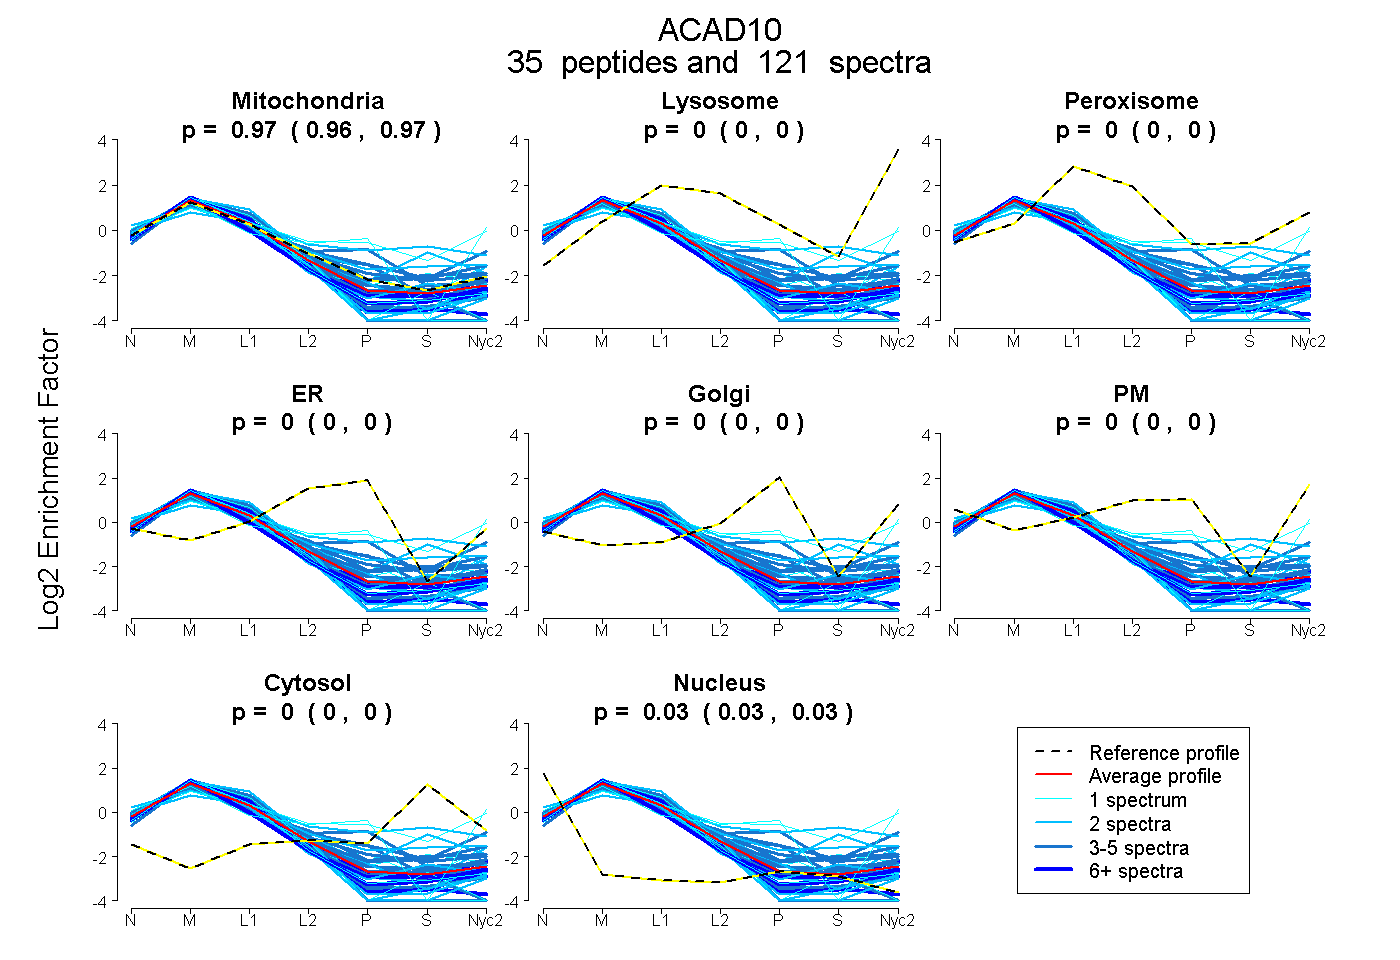
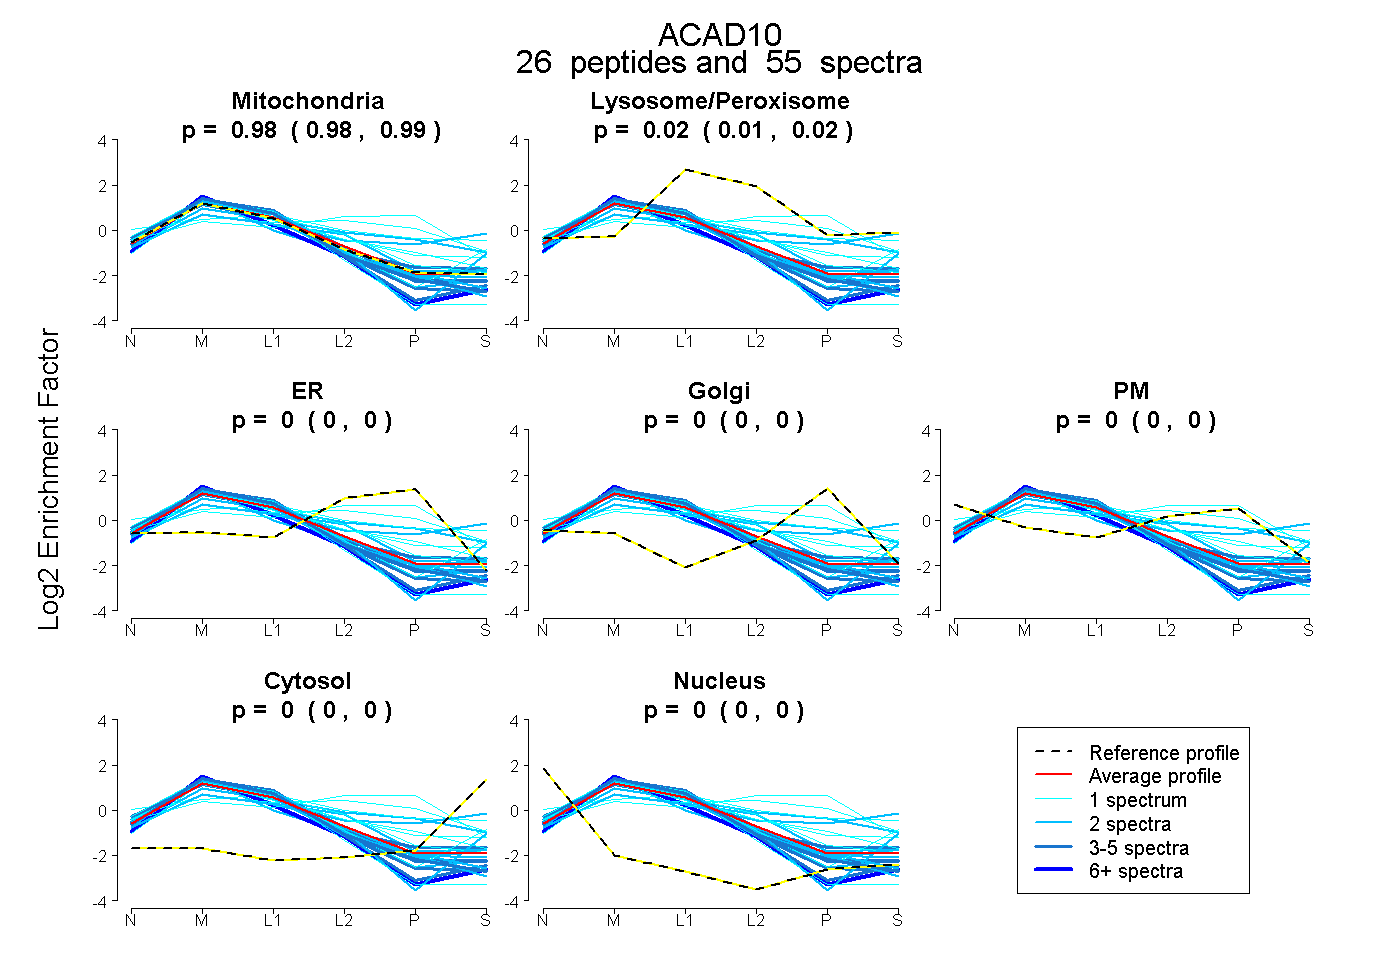
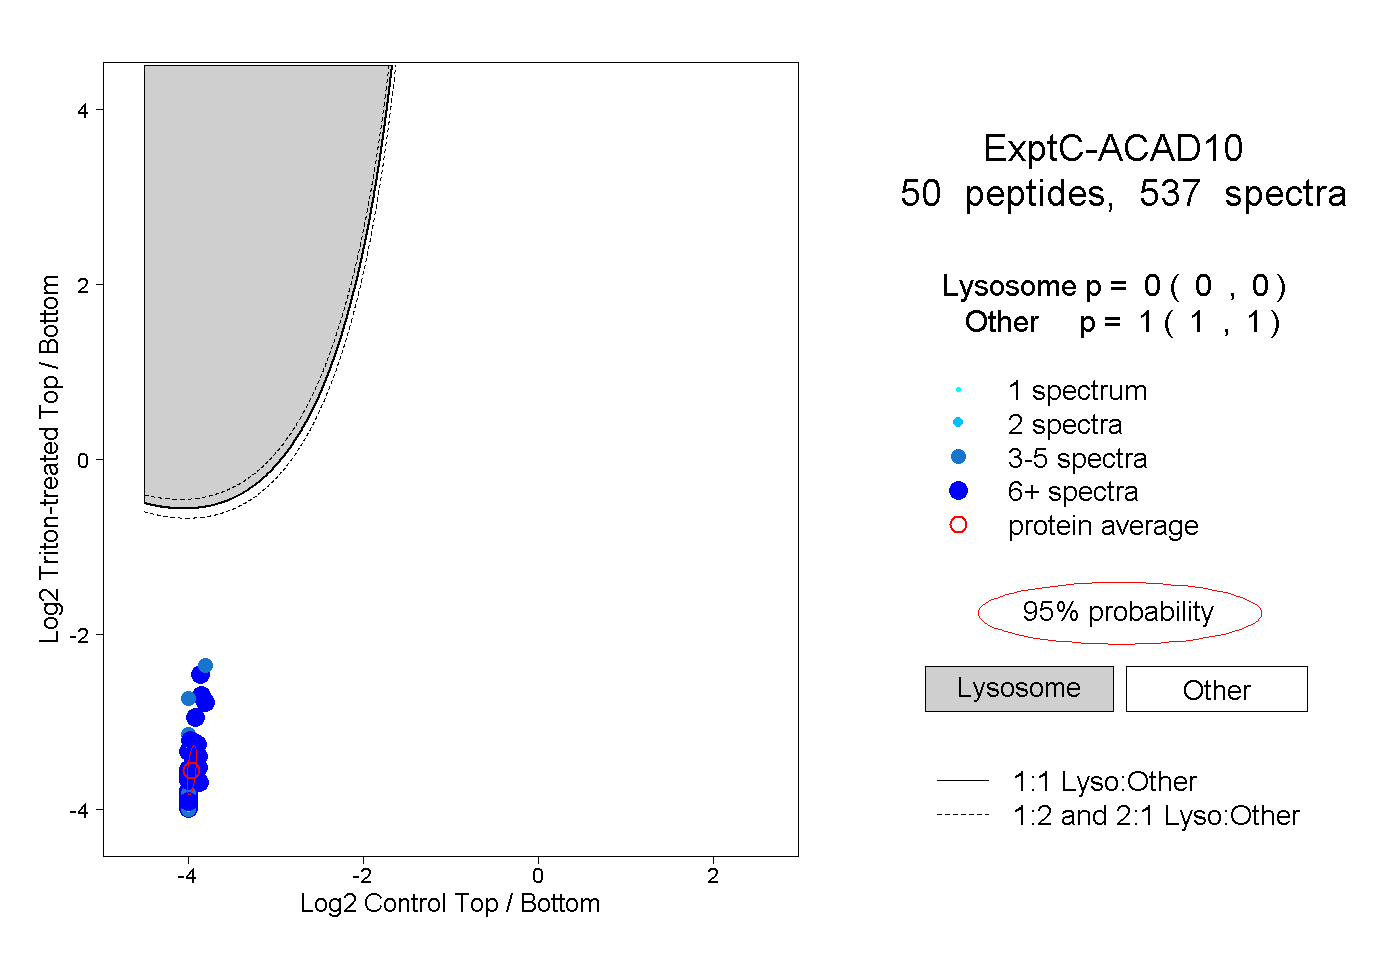
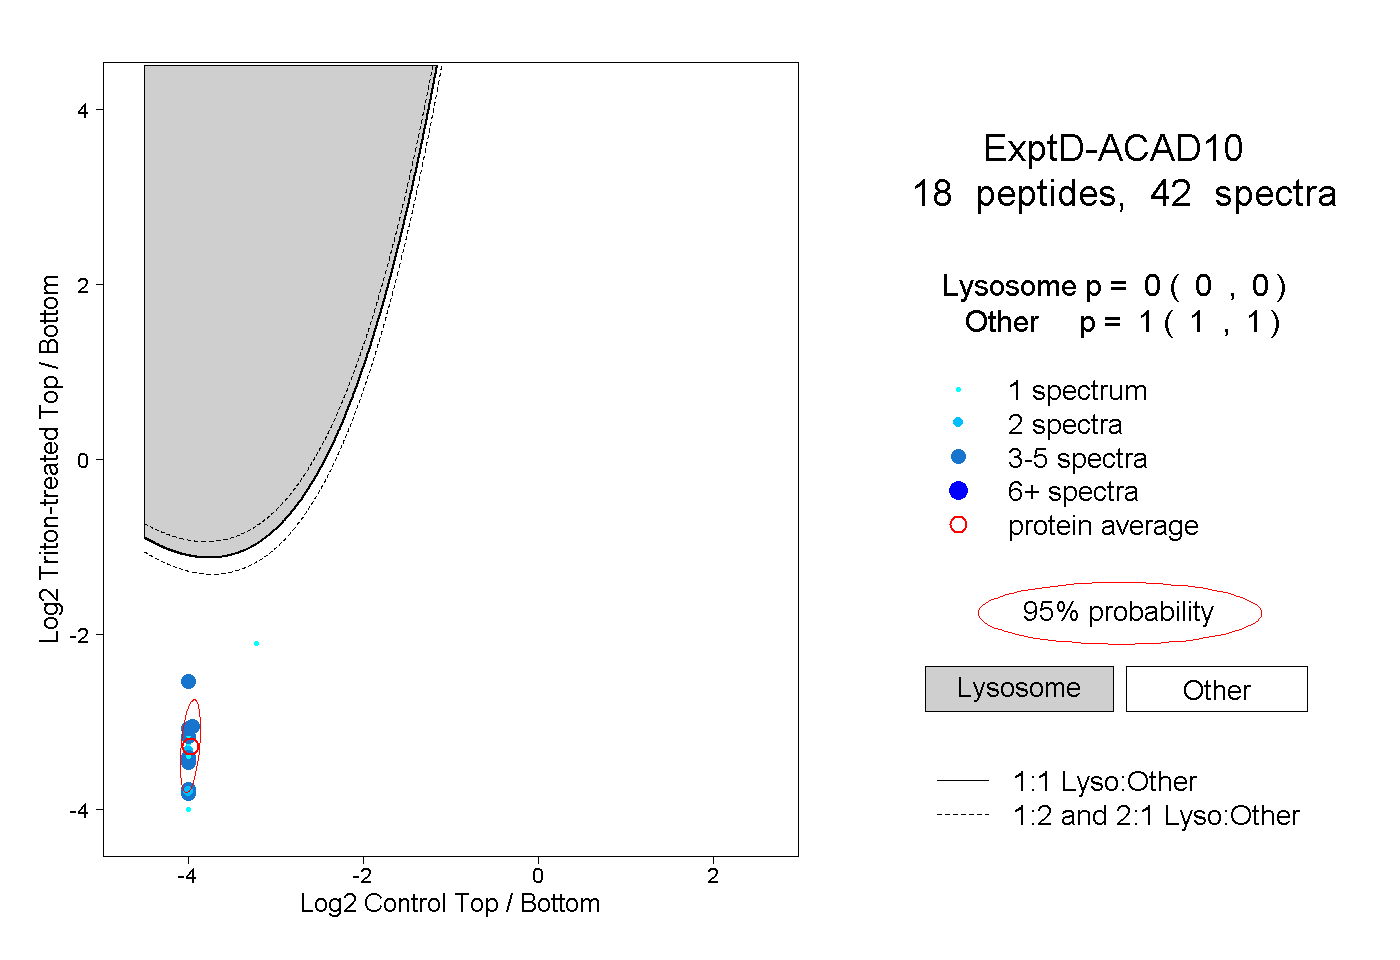
 35
35