 35
35peptides
spectra
0.965 | 0.968
0.000 | 0.000
0.000 | 0.000
0.000 | 0.000
0.000 | 0.000
0.000 | 0.000
0.000 | 0.000
0.032 | 0.035
| Plot | Mito | Lyso | Perox | ER | Golgi | PM | Cytosol | Nucleus | |||||
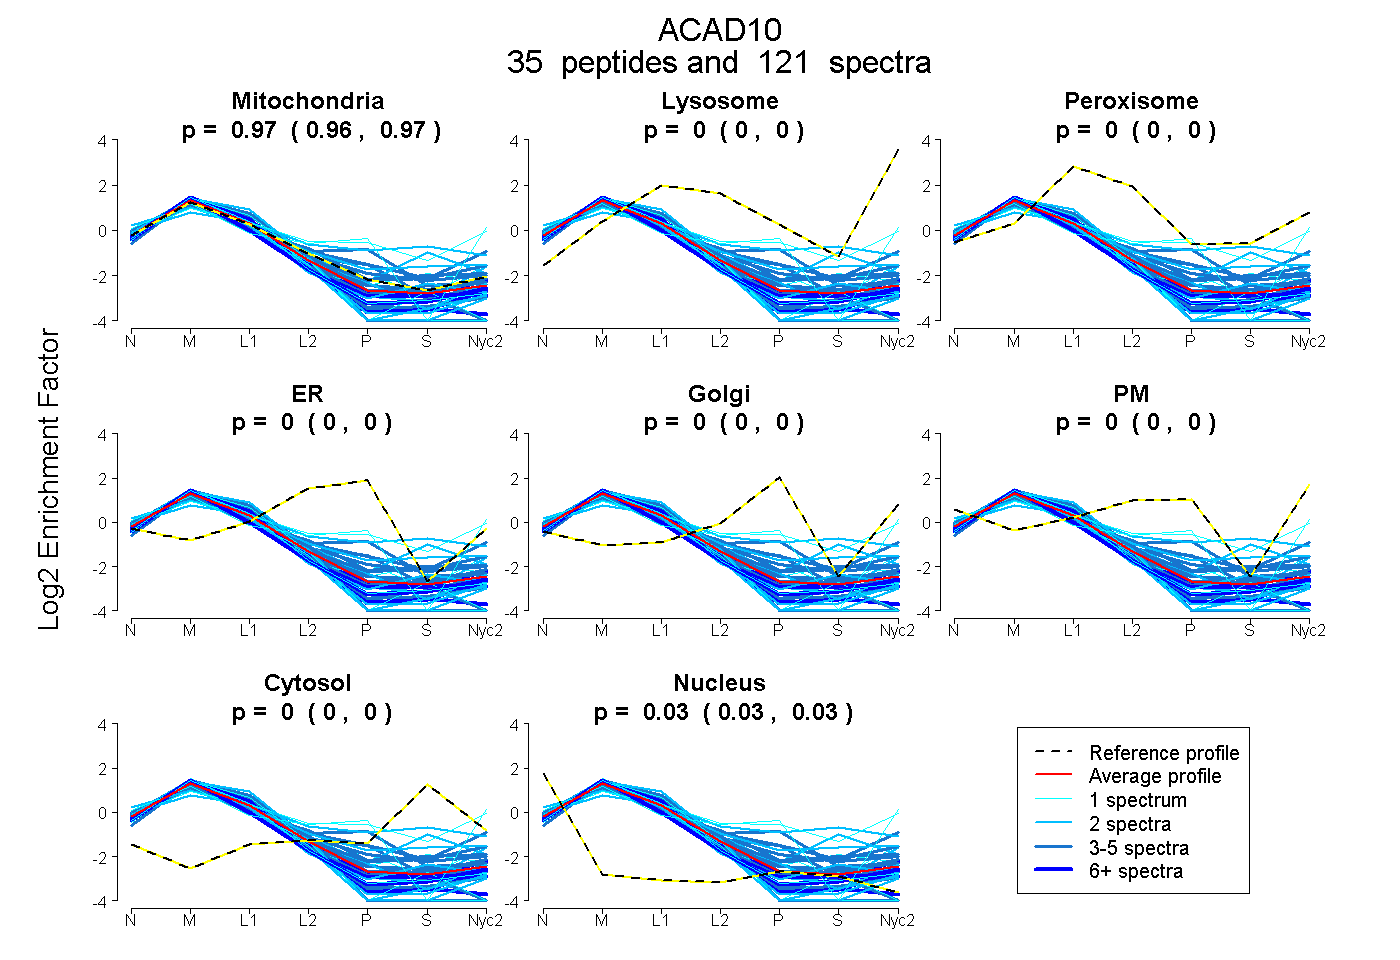
| Expt A |
35 peptides |
121 spectra |
|
0.966 0.965 | 0.968 |
0.000 0.000 | 0.000 |
0.000 0.000 | 0.000 |
0.000 0.000 | 0.000 |
0.000 0.000 | 0.000 |
0.000 0.000 | 0.000 |
0.000 0.000 | 0.000 |
0.034 0.032 | 0.035 |
| 4 spectra, LDNLMFRPEK | 0.901 | 0.009 | 0.007 | 0.000 | 0.000 | 0.000 | 0.083 | 0.000 | ||
| 3 spectra, ELEDLLGFPLHGGVPNTRPVR | 0.938 | 0.000 | 0.000 | 0.000 | 0.000 | 0.000 | 0.000 | 0.062 | ||
| 1 spectrum, VAAILQGVYK | 0.870 | 0.000 | 0.000 | 0.000 | 0.000 | 0.000 | 0.000 | 0.130 | ||
| 3 spectra, LCVFMGK | 0.790 | 0.000 | 0.000 | 0.182 | 0.000 | 0.000 | 0.000 | 0.028 | ||
| 6 spectra, FLEEFGR | 0.931 | 0.000 | 0.000 | 0.000 | 0.000 | 0.000 | 0.000 | 0.069 | ||
| 3 spectra, GGLIISPEGLSPR | 0.932 | 0.000 | 0.000 | 0.000 | 0.000 | 0.000 | 0.000 | 0.068 | ||
| 3 spectra, LYDQLLQFMEQK | 0.895 | 0.021 | 0.000 | 0.000 | 0.000 | 0.000 | 0.084 | 0.000 | ||
| 2 spectra, DPSLPGLEPSR | 0.976 | 0.000 | 0.000 | 0.000 | 0.000 | 0.000 | 0.000 | 0.024 | ||
| 3 spectra, EAIYTAMNQVLCR | 0.886 | 0.000 | 0.000 | 0.000 | 0.000 | 0.000 | 0.000 | 0.114 | ||
| 1 spectrum, TMEIPQDALETYLK | 0.948 | 0.000 | 0.000 | 0.000 | 0.000 | 0.000 | 0.000 | 0.052 | ||
| 1 spectrum, WWISGILDPR | 0.521 | 0.000 | 0.000 | 0.000 | 0.078 | 0.401 | 0.000 | 0.000 | ||
| 6 spectra, AAETSSIPAMER | 0.999 | 0.000 | 0.000 | 0.000 | 0.000 | 0.000 | 0.000 | 0.001 | ||
| 4 spectra, TDPQAPR | 0.977 | 0.000 | 0.000 | 0.000 | 0.000 | 0.000 | 0.000 | 0.023 | ||
| 3 spectra, AAHLMDVAGNK | 0.974 | 0.000 | 0.000 | 0.000 | 0.000 | 0.000 | 0.000 | 0.026 | ||
| 2 spectra, SFIPVER | 0.757 | 0.000 | 0.074 | 0.000 | 0.000 | 0.049 | 0.112 | 0.008 | ||
| 2 spectra, VDIEQAR | 0.921 | 0.000 | 0.000 | 0.000 | 0.000 | 0.000 | 0.000 | 0.079 | ||
| 4 spectra, GFEIAQGR | 0.920 | 0.000 | 0.000 | 0.000 | 0.000 | 0.000 | 0.000 | 0.080 | ||
| 1 spectrum, SFLPLDR | 0.484 | 0.173 | 0.023 | 0.000 | 0.039 | 0.178 | 0.102 | 0.000 | ||
| 10 spectra, MVAPSMAYR | 0.957 | 0.000 | 0.000 | 0.000 | 0.000 | 0.000 | 0.000 | 0.043 | ||
| 3 spectra, FADGPDEVHQLTVAK | 0.770 | 0.088 | 0.000 | 0.000 | 0.000 | 0.103 | 0.039 | 0.000 | ||
| 1 spectrum, GEMTMER | 0.935 | 0.000 | 0.000 | 0.000 | 0.000 | 0.000 | 0.065 | 0.000 | ||
| 2 spectra, GLLGTR | 0.785 | 0.000 | 0.003 | 0.000 | 0.000 | 0.000 | 0.212 | 0.000 | ||
| 2 spectra, TAFGKPLVEHGTILADIAR | 0.991 | 0.000 | 0.000 | 0.000 | 0.000 | 0.000 | 0.000 | 0.009 | ||
| 2 spectra, LQEPAAPR | 0.994 | 0.000 | 0.000 | 0.000 | 0.000 | 0.000 | 0.000 | 0.006 | ||
| 2 spectra, QVQTWTK | 0.926 | 0.000 | 0.000 | 0.000 | 0.000 | 0.000 | 0.000 | 0.074 | ||
| 4 spectra, LLQFDHGQSNPTYYIR | 0.917 | 0.000 | 0.065 | 0.000 | 0.000 | 0.000 | 0.018 | 0.000 | ||
| 6 spectra, WLAPLLEGR | 0.924 | 0.000 | 0.000 | 0.000 | 0.000 | 0.000 | 0.000 | 0.076 | ||
| 1 spectrum, AAALEIAMIK | 0.931 | 0.000 | 0.000 | 0.000 | 0.000 | 0.059 | 0.000 | 0.010 | ||
| 1 spectrum, YTGPMK | 0.953 | 0.000 | 0.000 | 0.000 | 0.000 | 0.000 | 0.000 | 0.047 | ||
| 2 spectra, VIRPLSVFGLEDPPGGHGEVQFK | 0.914 | 0.000 | 0.000 | 0.000 | 0.000 | 0.000 | 0.000 | 0.086 | ||
| 3 spectra, ENILLGPGR | 0.983 | 0.000 | 0.000 | 0.000 | 0.000 | 0.000 | 0.000 | 0.017 | ||
| 3 spectra, LIGYSER | 0.937 | 0.000 | 0.000 | 0.000 | 0.000 | 0.000 | 0.000 | 0.063 | ||
| 1 spectrum, LTESMAELAWDFAIK | 0.896 | 0.000 | 0.000 | 0.000 | 0.000 | 0.000 | 0.000 | 0.104 | ||
| 24 spectra, AMPATTTLTR | 0.910 | 0.000 | 0.000 | 0.000 | 0.000 | 0.000 | 0.000 | 0.090 | ||
| 2 spectra, QGDYISR | 0.510 | 0.000 | 0.221 | 0.000 | 0.068 | 0.000 | 0.201 | 0.000 |
| Plot | Mito | Lyso or Perox | ER | Golgi | PM | Cytosol | Nucleus | ||||||
| Expt B |
26 peptides |
55 spectra |
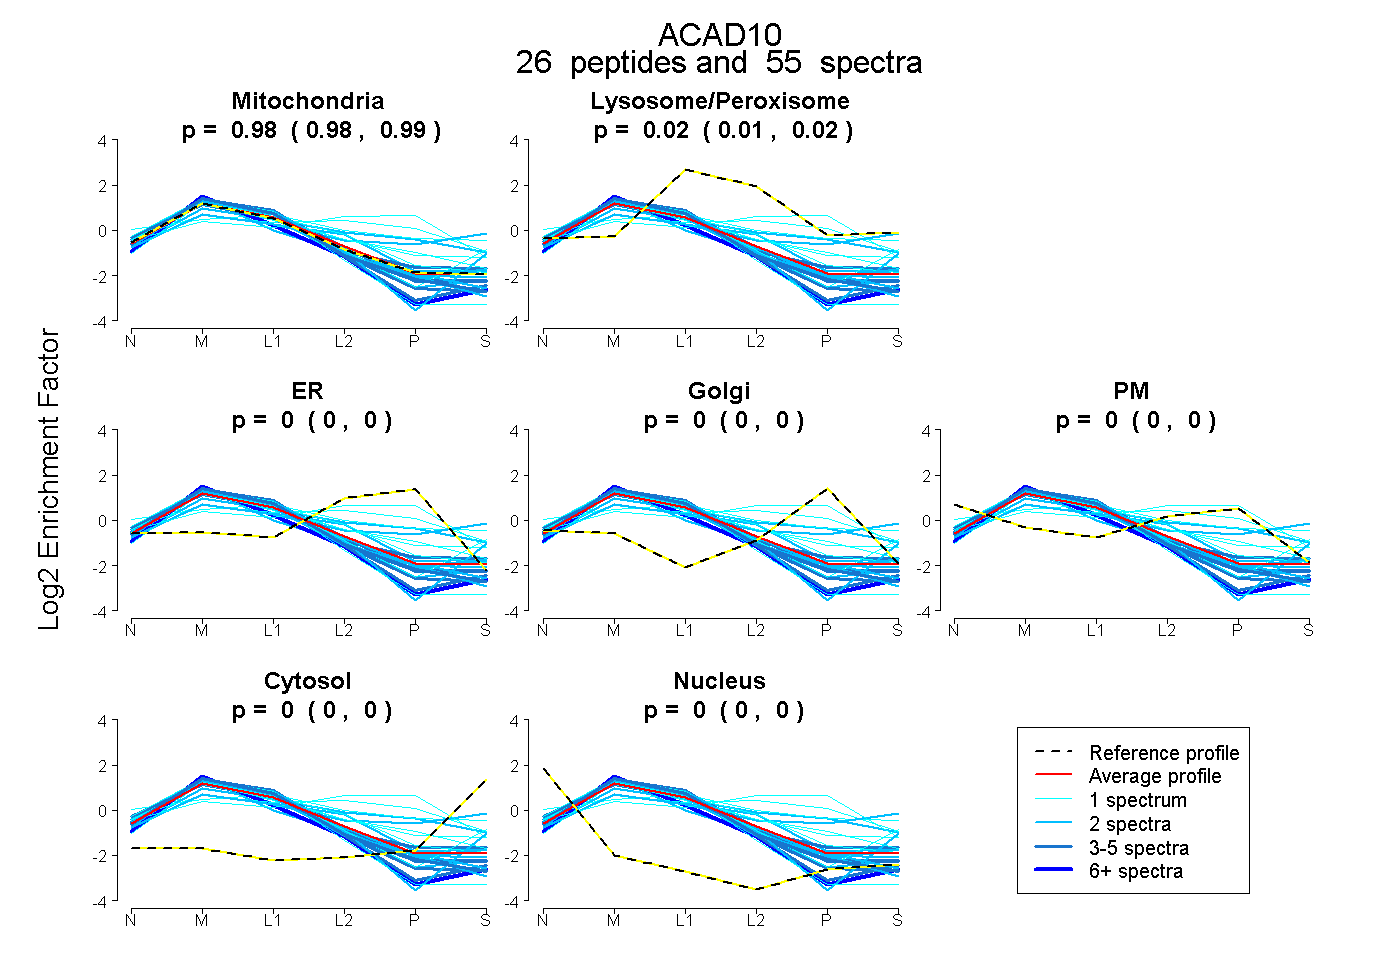 |
0.983 0.975 | 0.988 |
0.017 0.011 | 0.023 |
0.000 0.000 | 0.002 |
0.000 0.000 | 0.000 |
0.000 0.000 | 0.000 |
0.000 0.000 | 0.000 |
0.000 0.000 | 0.000 |
|||
| Plot | Lyso | Other | |||||||||||
| Expt C |
50 peptides |
537 spectra |
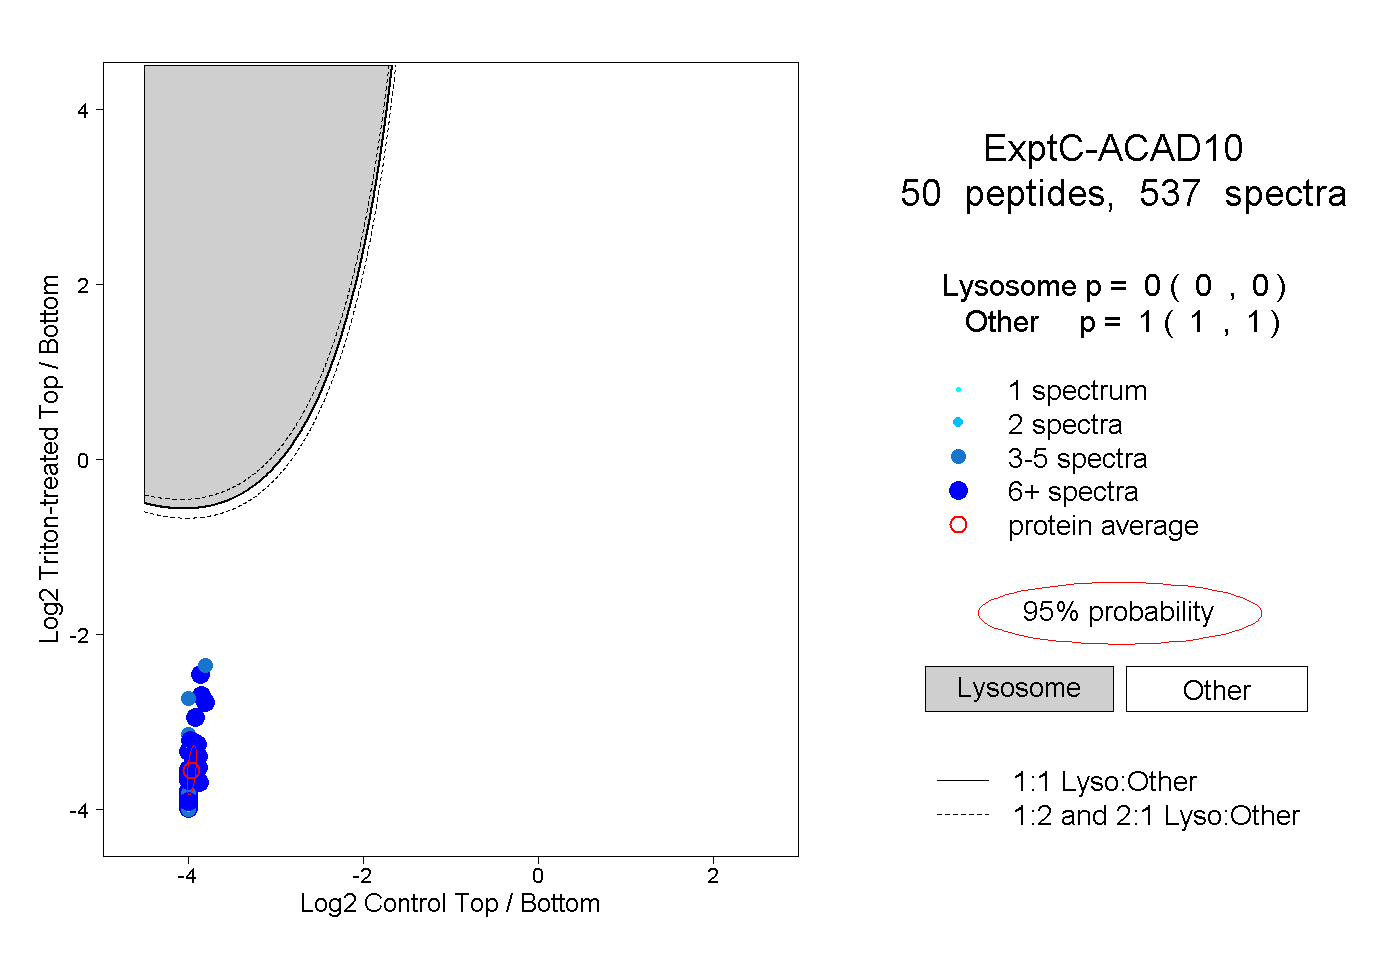 |
0.000 0.000 | 0.000 |
1.000 1.000 | 1.000 |
||||||||
| Plot | Lyso | Other | |||||||||||
| Expt D |
18 peptides |
42 spectra |
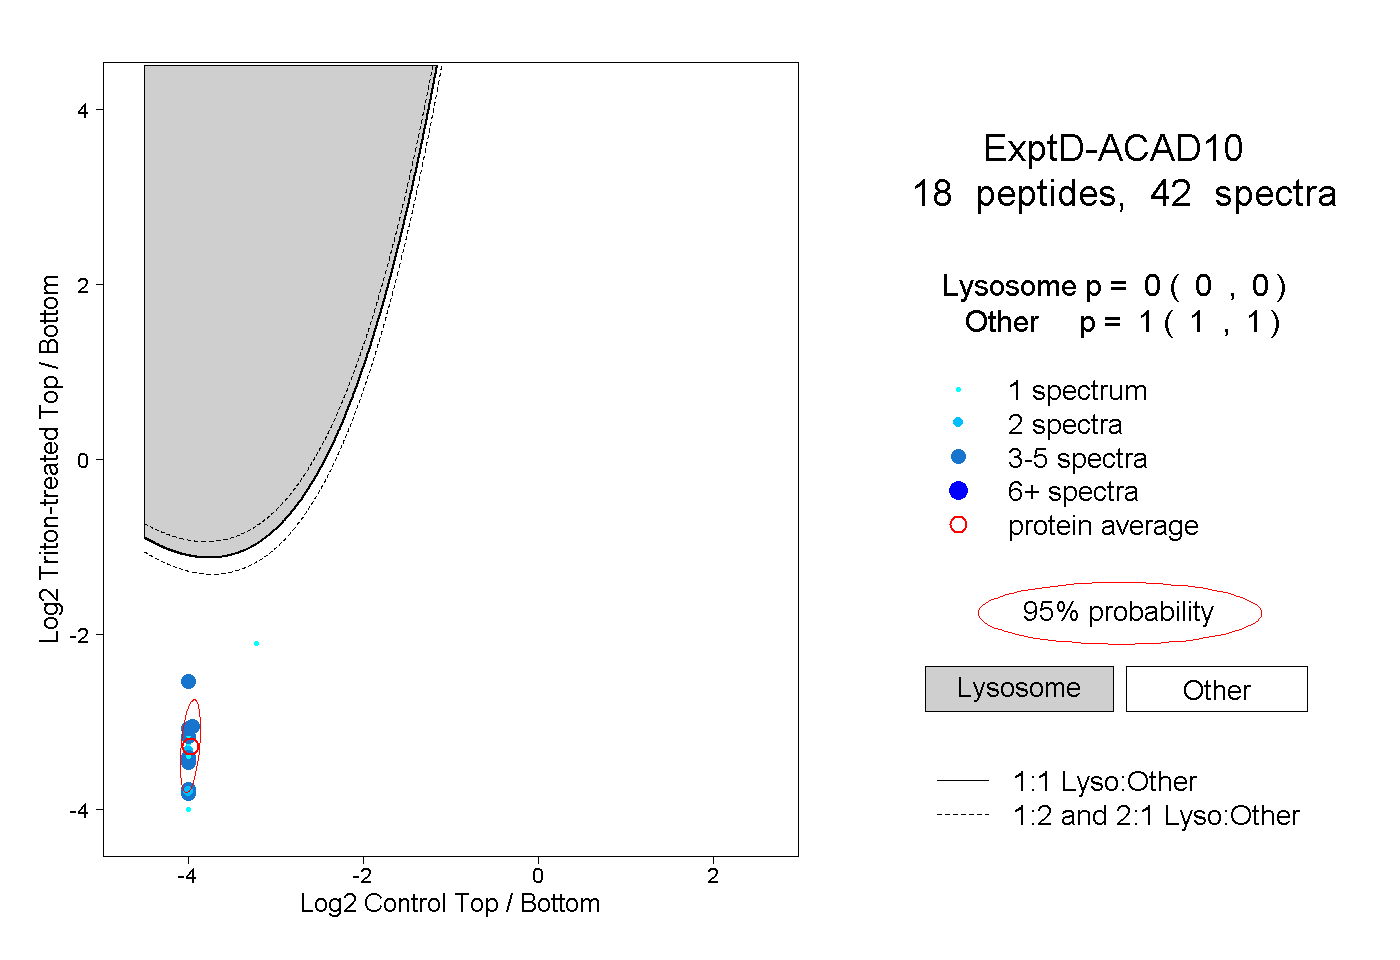 |
0.000 0.000 | 0.000 |
1.000 1.000 | 1.000 |