 11
11peptides
spectra
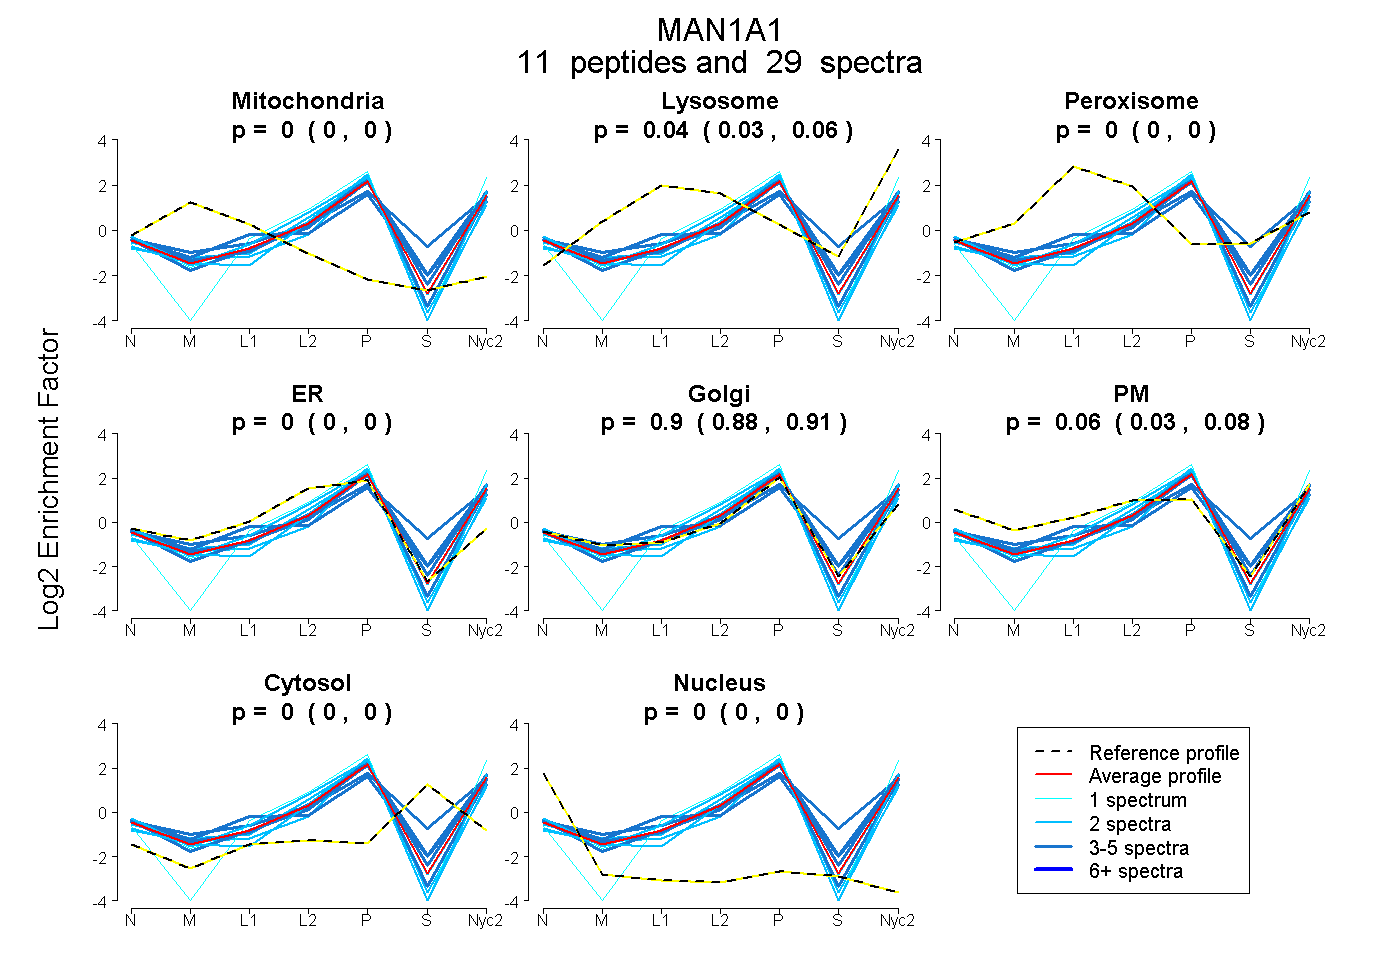
0.000 | 0.000
0.030 | 0.056
0.000 | 0.000
0.000 | 0.000
0.882 | 0.914
0.029 | 0.078
0.000 | 0.000
0.000 | 0.000
6peptides
spectra
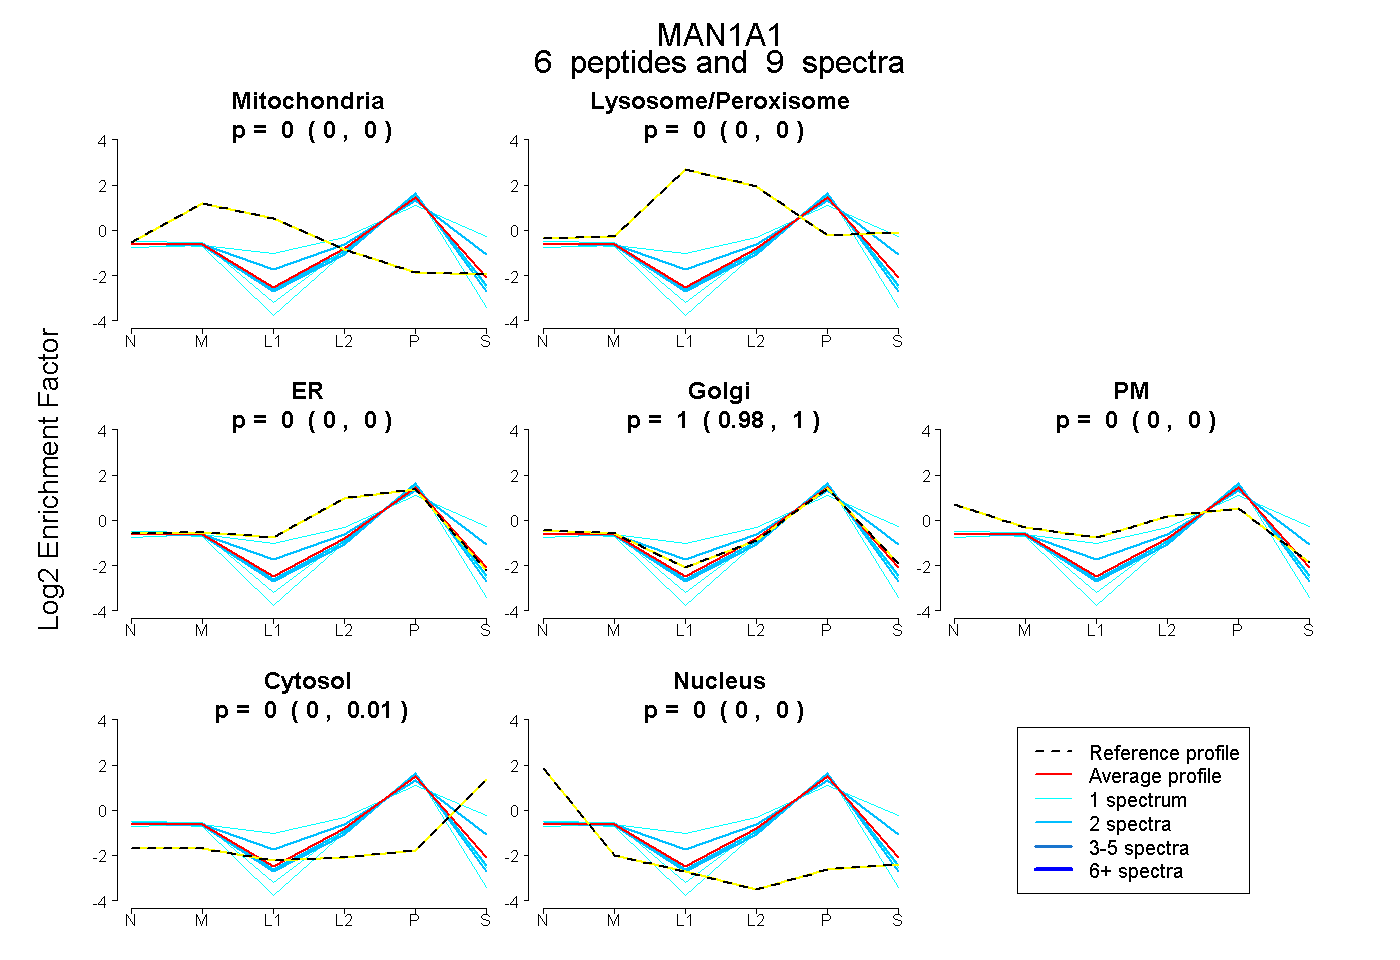
0.000 | 0.000
0.000 | 0.000
0.000 | 0.000
0.980 | 1.000
0.000 | 0.000
0.000 | 0.010
0.000 | 0.000
18peptides
spectra
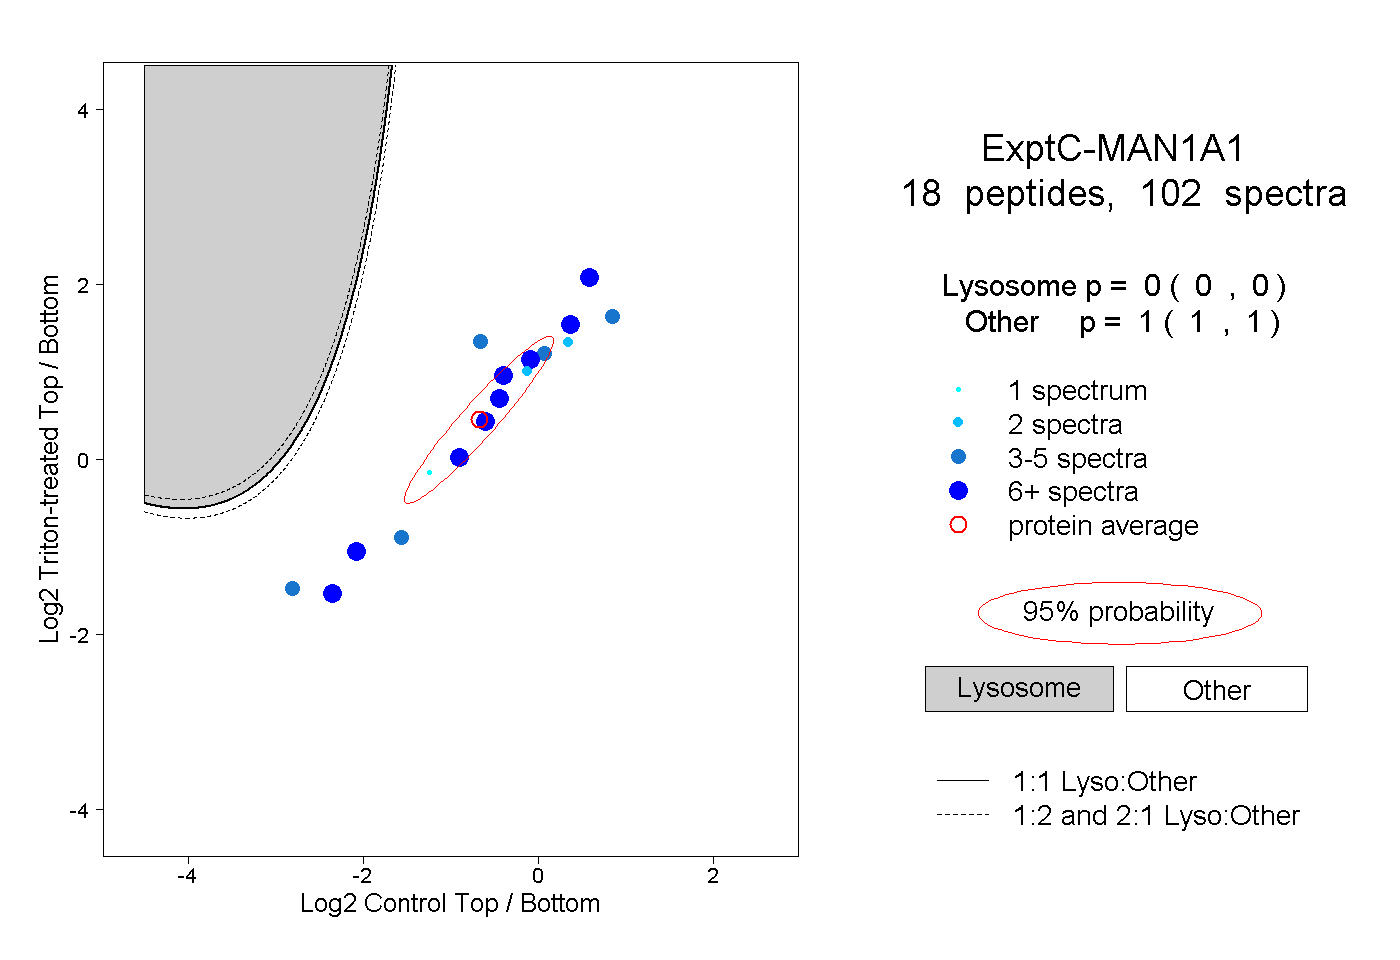
0.000 | 0.000
1.000 | 1.000
5peptides
spectra
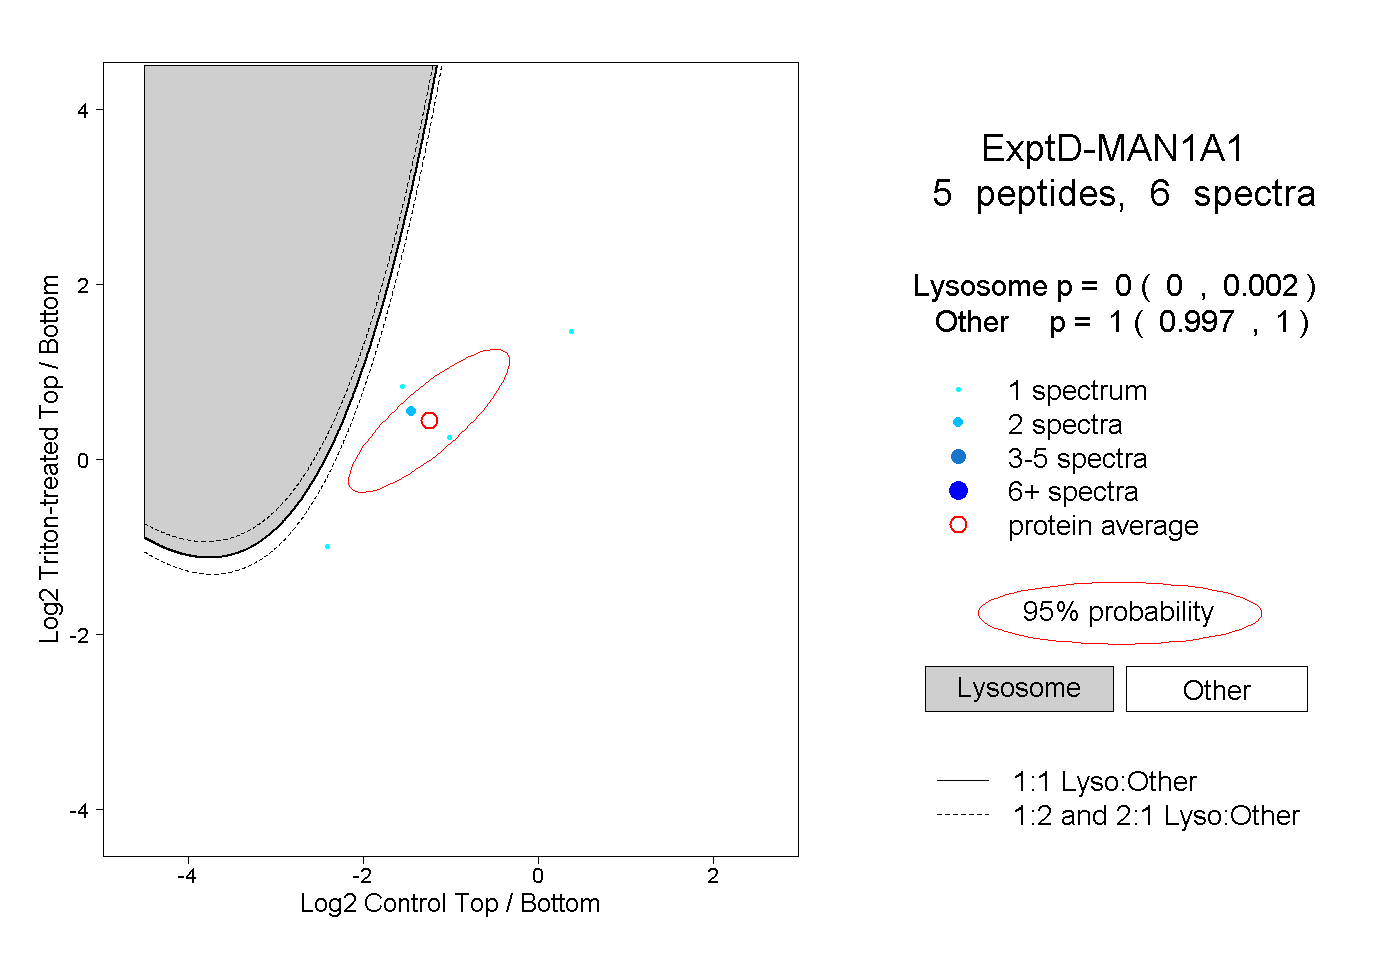
0.000 | 0.002
0.997 | 1.000