 9
9peptides
spectra
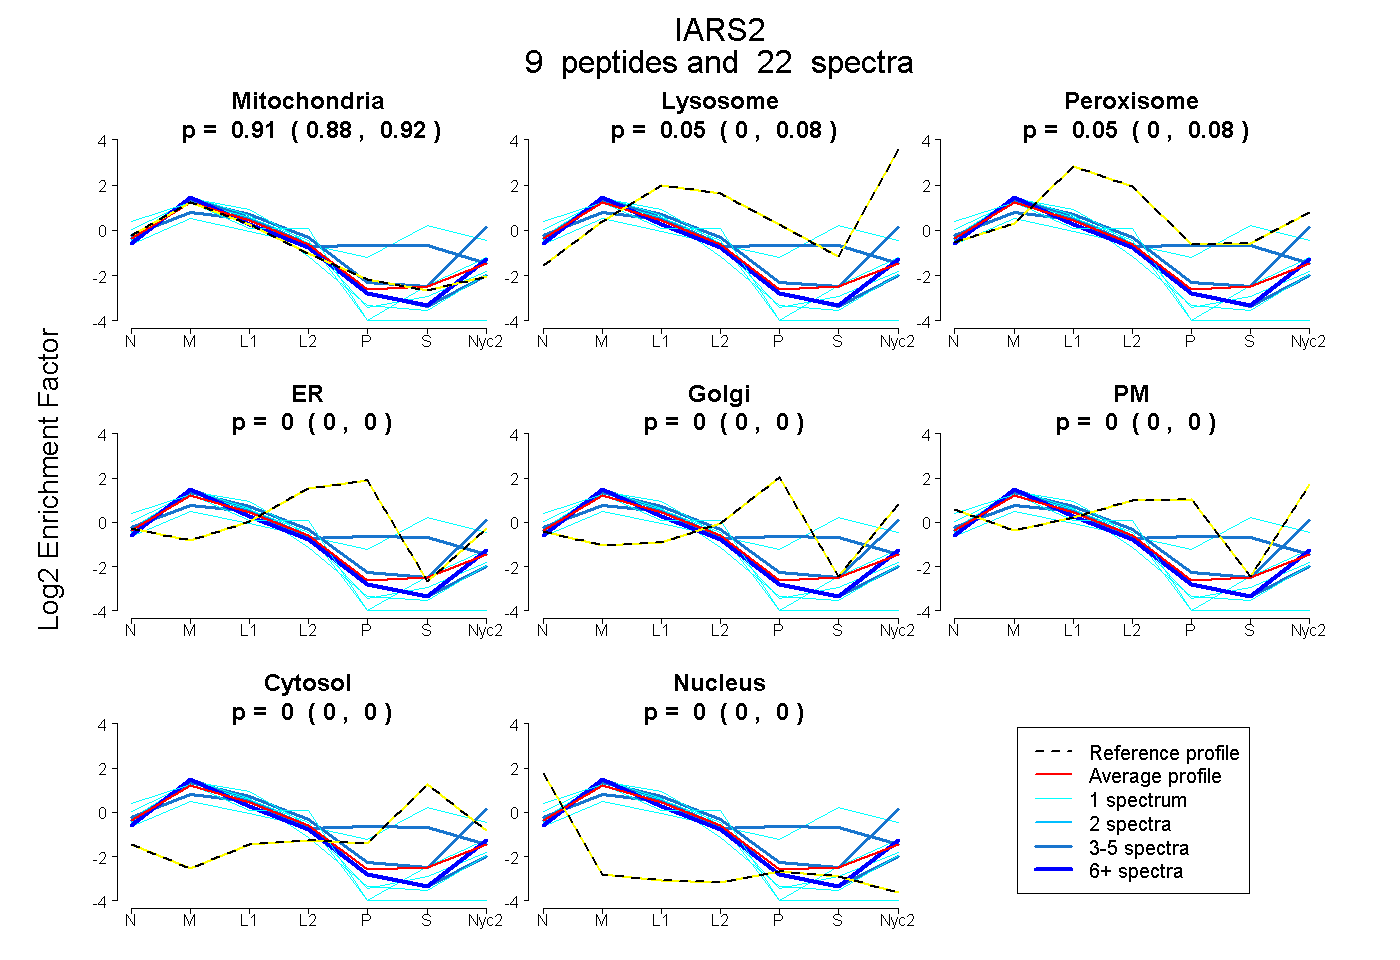
0.885 | 0.923
0.001 | 0.080
0.002 | 0.085
0.000 | 0.000
0.000 | 0.000
0.000 | 0.000
0.000 | 0.003
0.000 | 0.000
3peptides
spectra
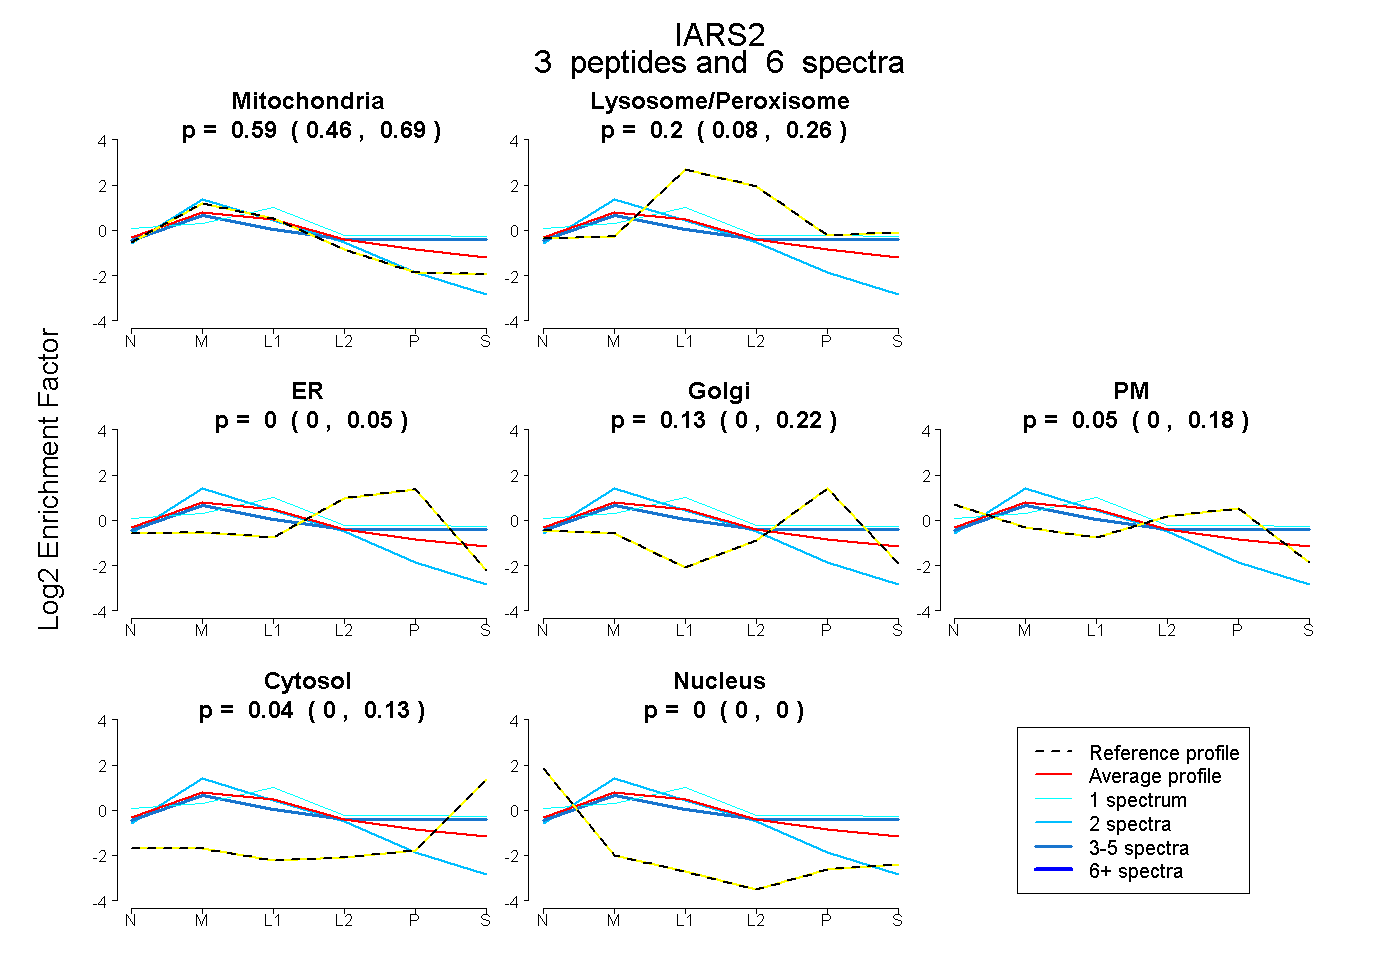
0.458 | 0.685
0.083 | 0.263
0.000 | 0.049
0.000 | 0.219
0.000 | 0.176
0.000 | 0.132
0.000 | 0.000
11peptides
spectra
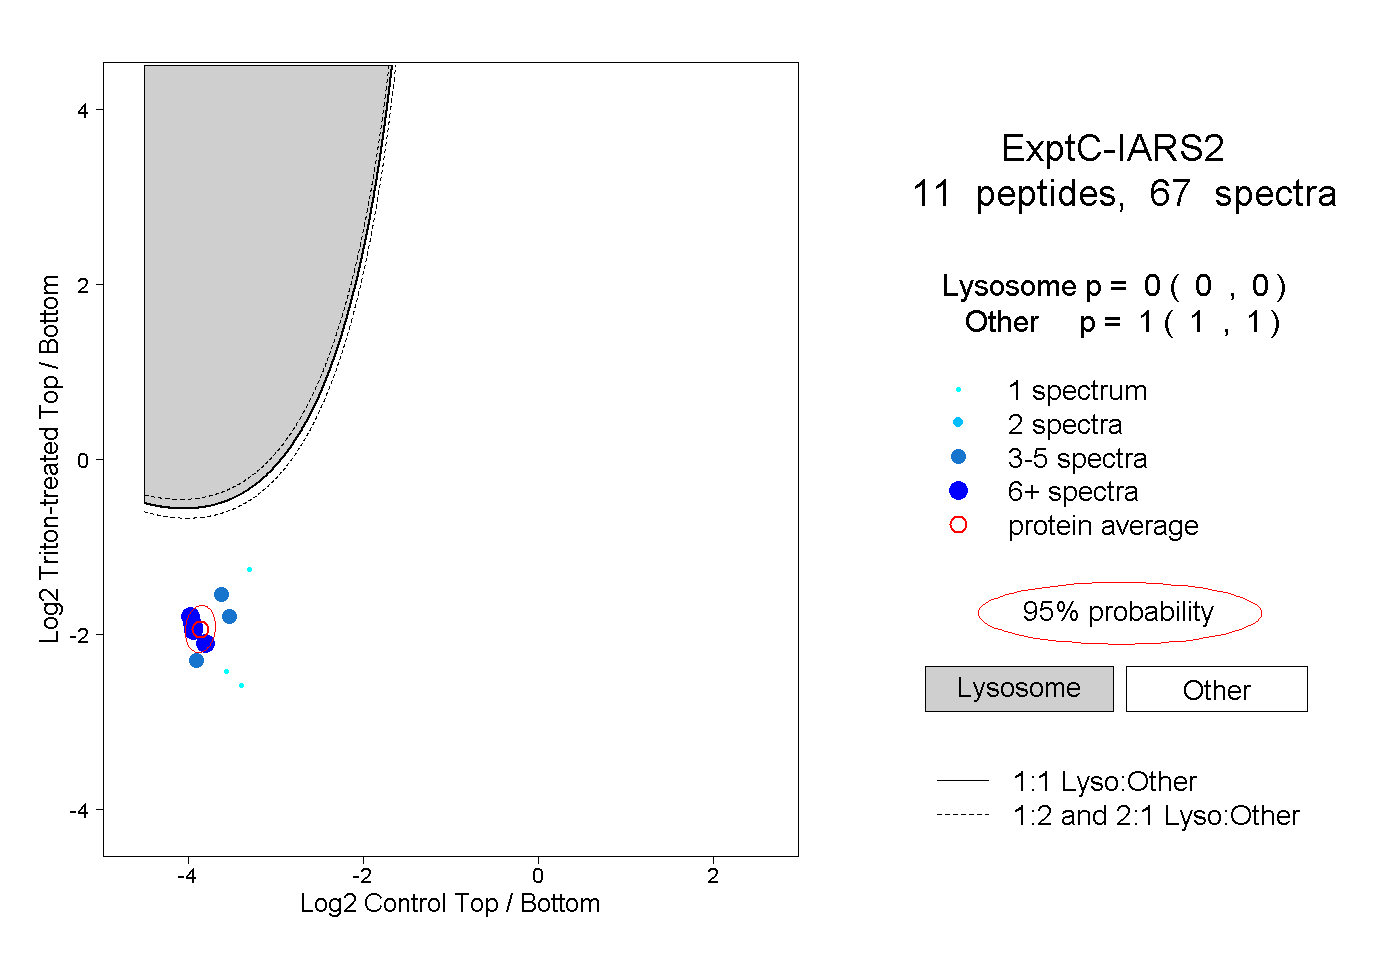
0.000 | 0.000
1.000 | 1.000
4peptides
spectra
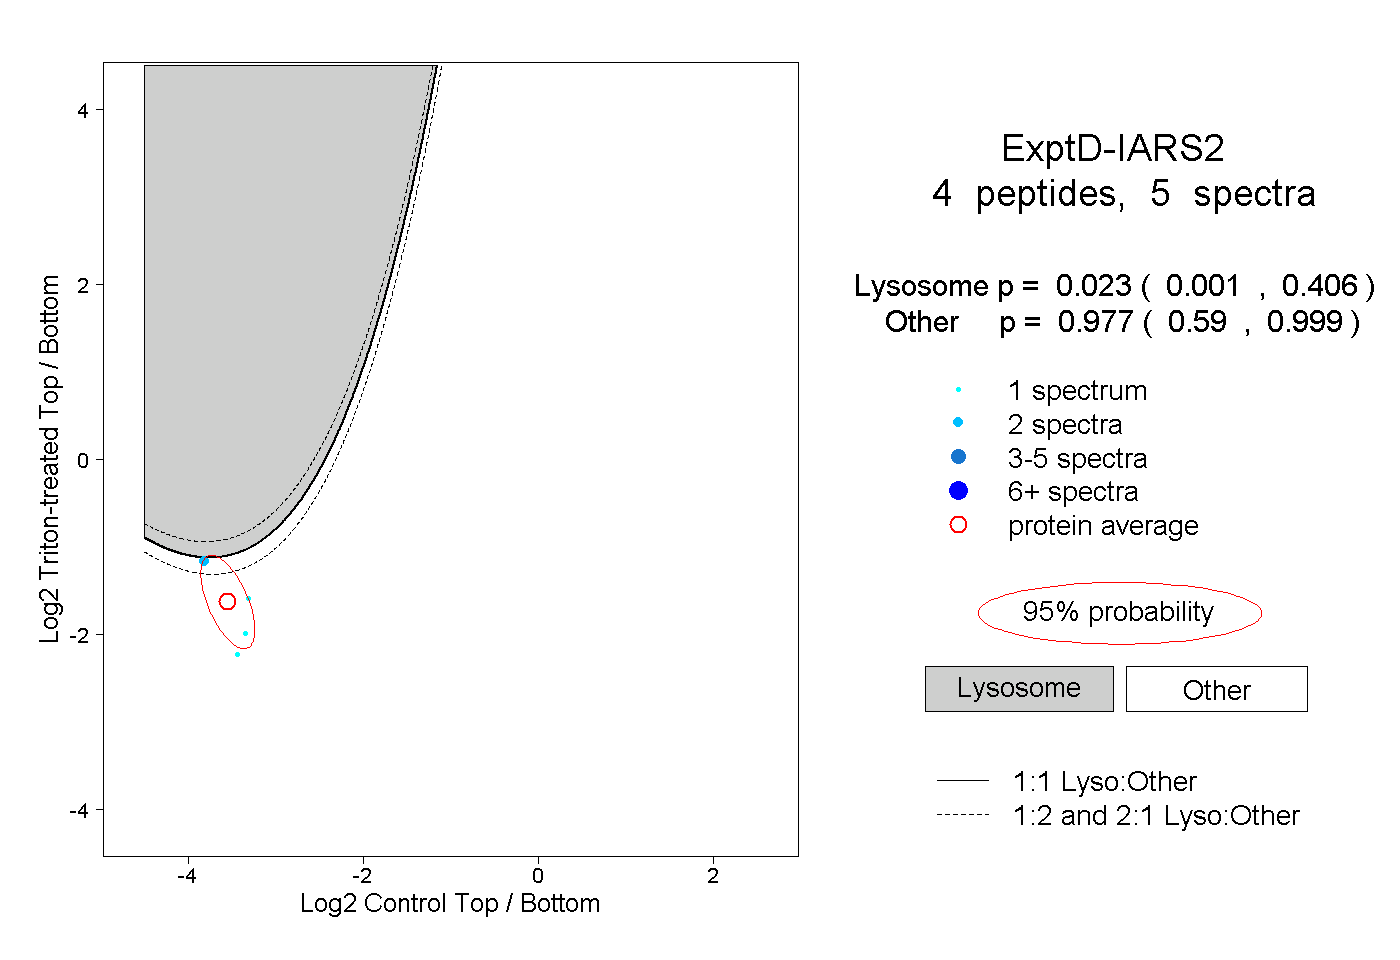
0.001 | 0.406
0.590 | 0.999