 9
9peptides
spectra
0.885 | 0.923
0.001 | 0.080
0.002 | 0.085
0.000 | 0.000
0.000 | 0.000
0.000 | 0.000
0.000 | 0.003
0.000 | 0.000
| Plot | Mito | Lyso | Perox | ER | Golgi | PM | Cytosol | Nucleus | |||||
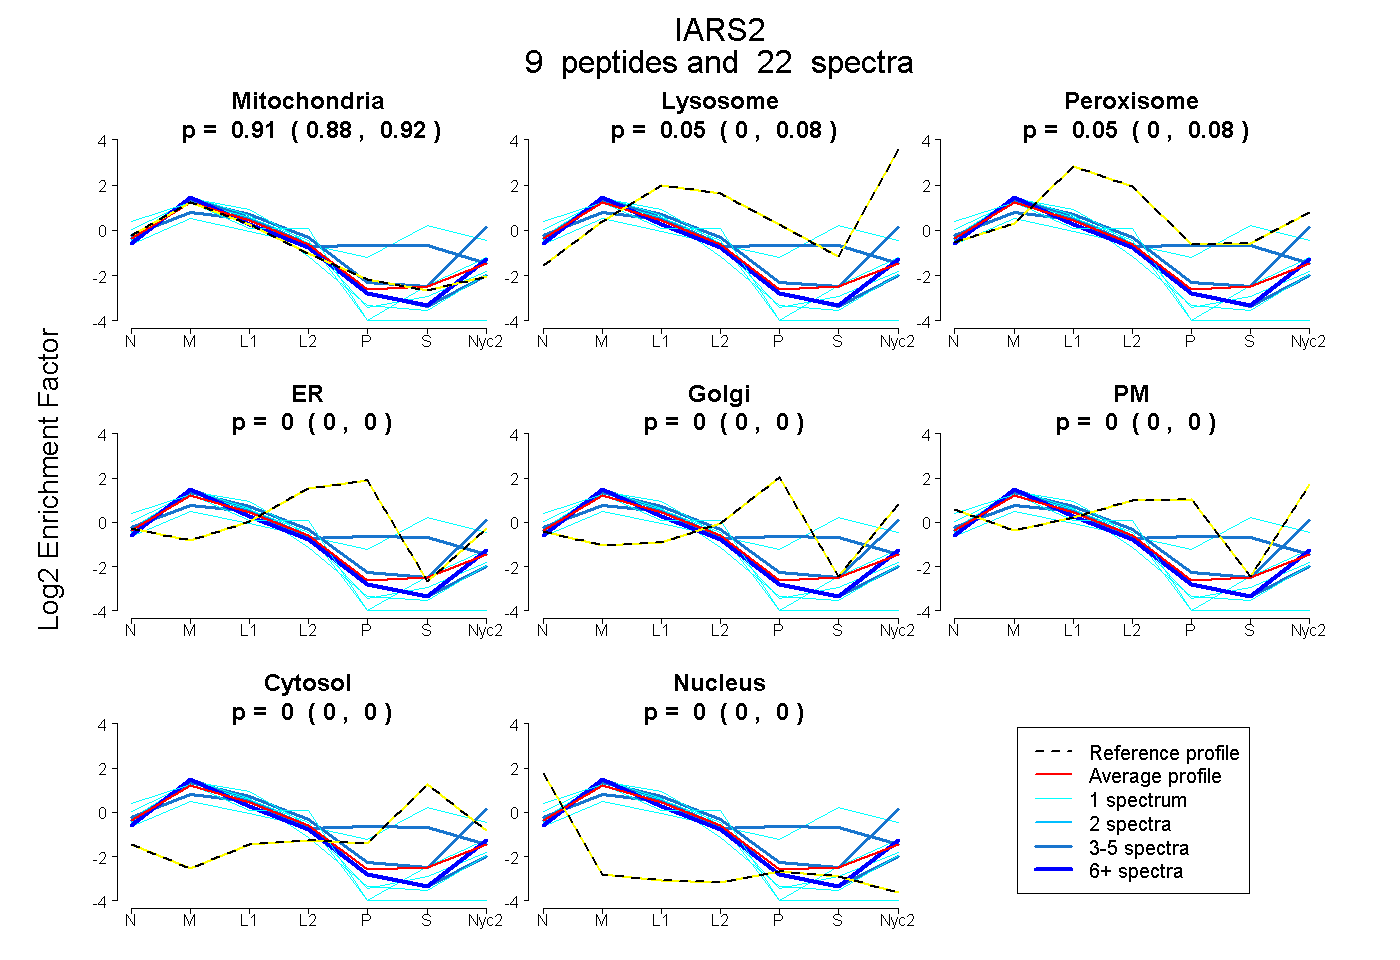
| Expt A |
9 peptides |
22 spectra |
|
0.908 0.885 | 0.923 |
0.046 0.001 | 0.080 |
0.046 0.002 | 0.085 |
0.000 0.000 | 0.000 |
0.000 0.000 | 0.000 |
0.000 0.000 | 0.000 |
0.000 0.000 | 0.003 |
0.000 0.000 | 0.000 |
| 3 spectra, SFAQAAIEK | 0.716 | 0.284 | 0.000 | 0.000 | 0.000 | 0.000 | 0.000 | 0.000 | ||
| 1 spectrum, SYKPVYWSPSSR | 1.000 | 0.000 | 0.000 | 0.000 | 0.000 | 0.000 | 0.000 | 0.000 | ||
| 4 spectra, CGFSELYSWQR | 1.000 | 0.000 | 0.000 | 0.000 | 0.000 | 0.000 | 0.000 | 0.000 | ||
| 1 spectrum, LLGHQQSDMELEIQQK | 0.924 | 0.000 | 0.076 | 0.000 | 0.000 | 0.000 | 0.000 | 0.000 | ||
| 1 spectrum, DTVLLPQTNFPMK | 0.348 | 0.107 | 0.151 | 0.000 | 0.000 | 0.000 | 0.394 | 0.000 | ||
| 1 spectrum, SVAGADSPQSSPK | 0.967 | 0.000 | 0.033 | 0.000 | 0.000 | 0.000 | 0.000 | 0.000 | ||
| 1 spectrum, VHFVPGWDCHGLPIETK | 0.899 | 0.000 | 0.000 | 0.000 | 0.000 | 0.000 | 0.000 | 0.101 | ||
| 6 spectra, VFQQMYEK | 0.951 | 0.049 | 0.000 | 0.000 | 0.000 | 0.000 | 0.000 | 0.000 | ||
| 4 spectra, TALAEAELEYNPEHVSR | 0.522 | 0.000 | 0.206 | 0.000 | 0.074 | 0.000 | 0.198 | 0.000 |
| Plot | Mito | Lyso or Perox | ER | Golgi | PM | Cytosol | Nucleus | ||||||
| Expt B |
3 peptides |
6 spectra |
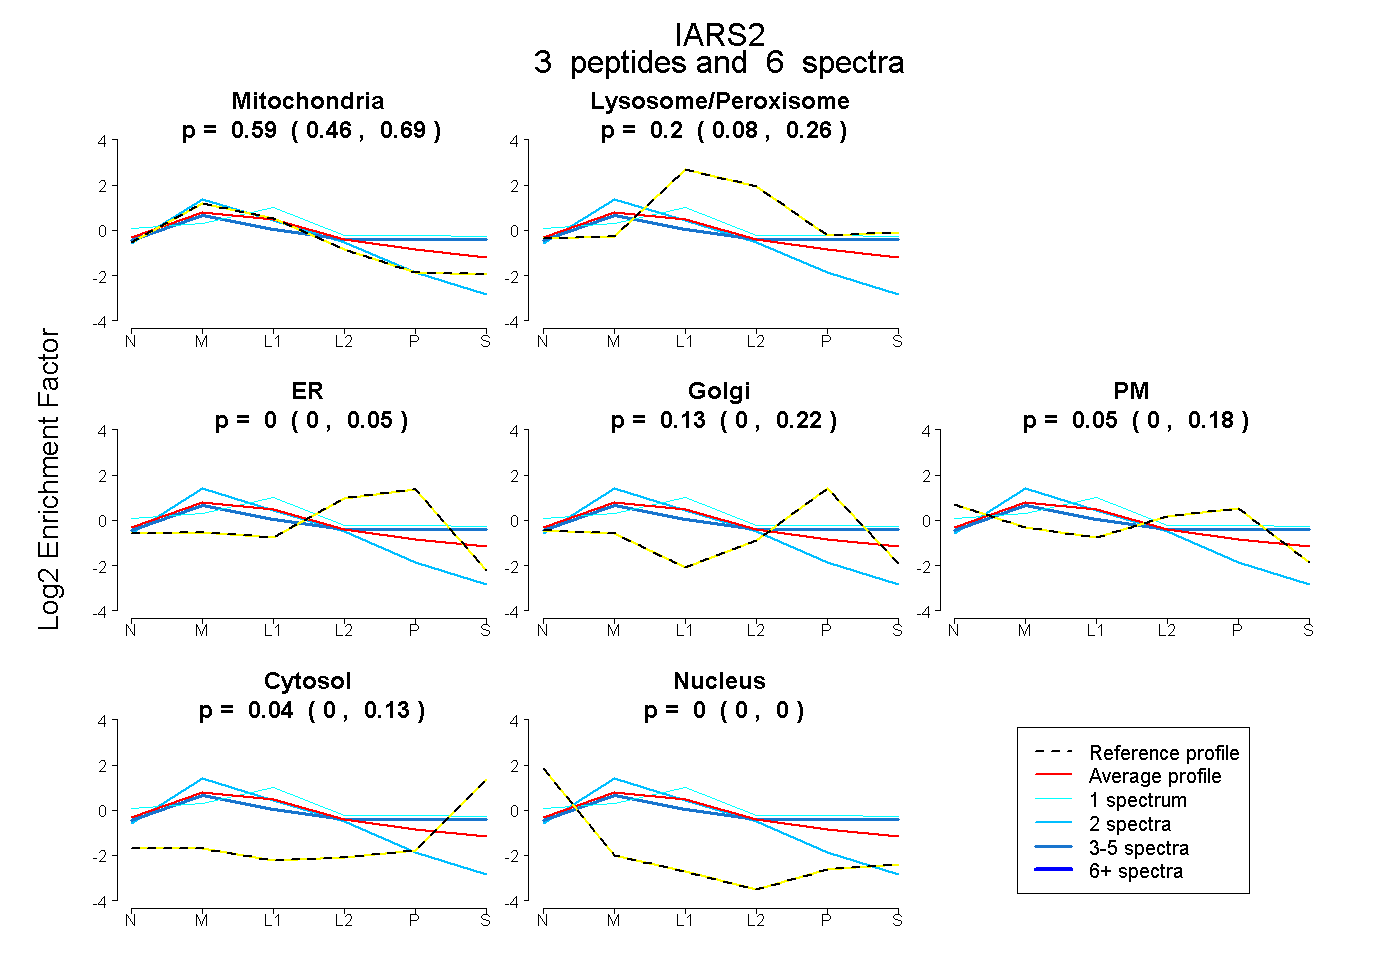 |
0.591 0.458 | 0.685 |
0.198 0.083 | 0.263 |
0.000 0.000 | 0.049 |
0.126 0.000 | 0.219 |
0.045 0.000 | 0.176 |
0.040 0.000 | 0.132 |
0.000 0.000 | 0.000 |
|||
| Plot | Lyso | Other | |||||||||||
| Expt C |
11 peptides |
67 spectra |
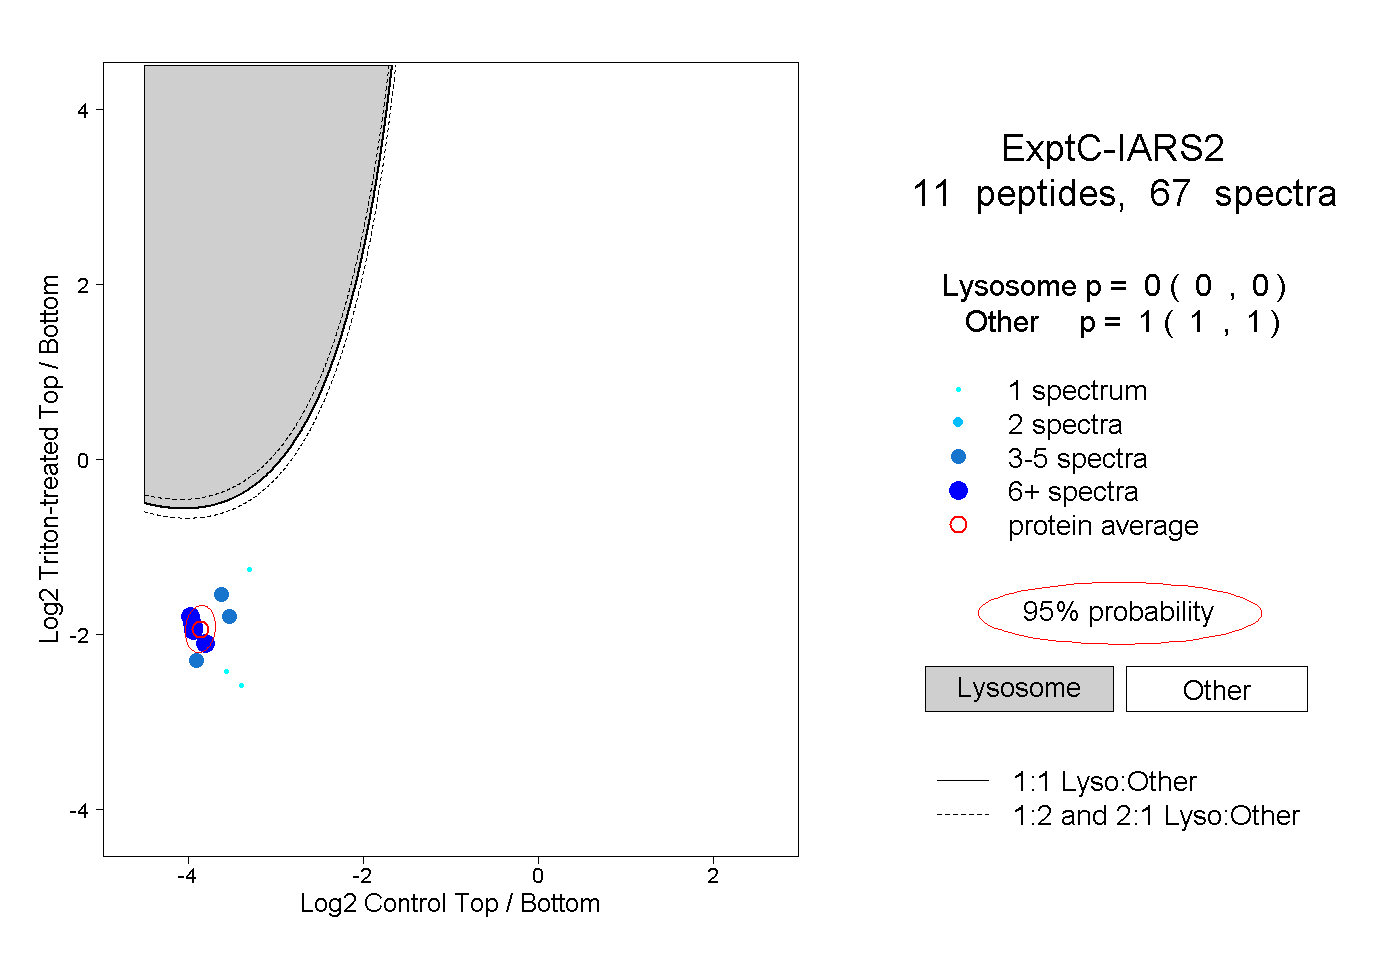 |
0.000 0.000 | 0.000 |
1.000 1.000 | 1.000 |
||||||||
| Plot | Lyso | Other | |||||||||||
| Expt D |
4 peptides |
5 spectra |
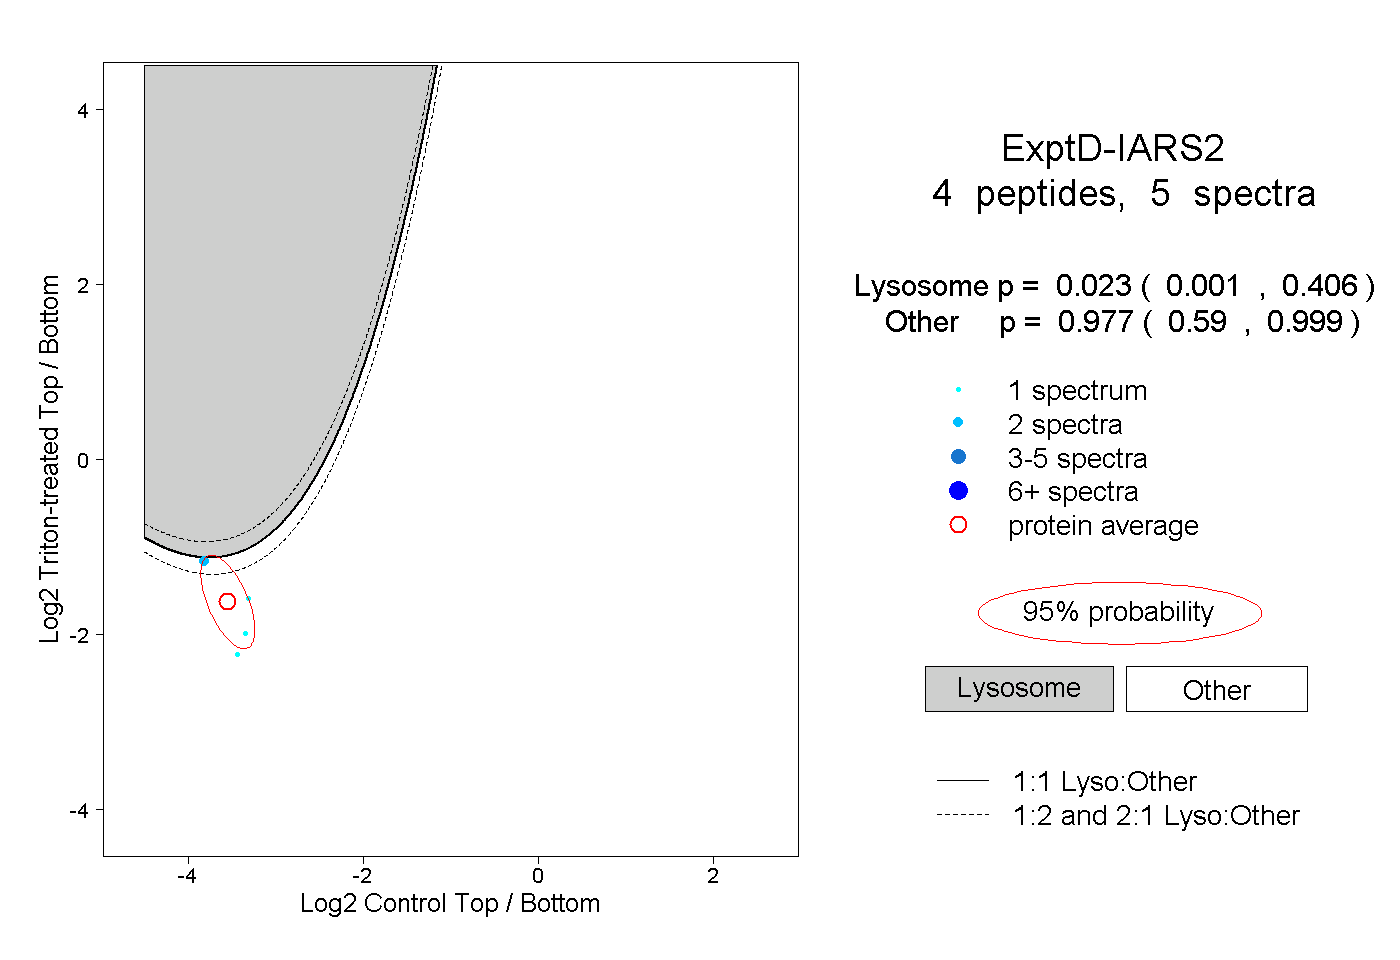 |
0.023 0.001 | 0.406 |
0.977 0.590 | 0.999 |