 9
9peptides
spectra
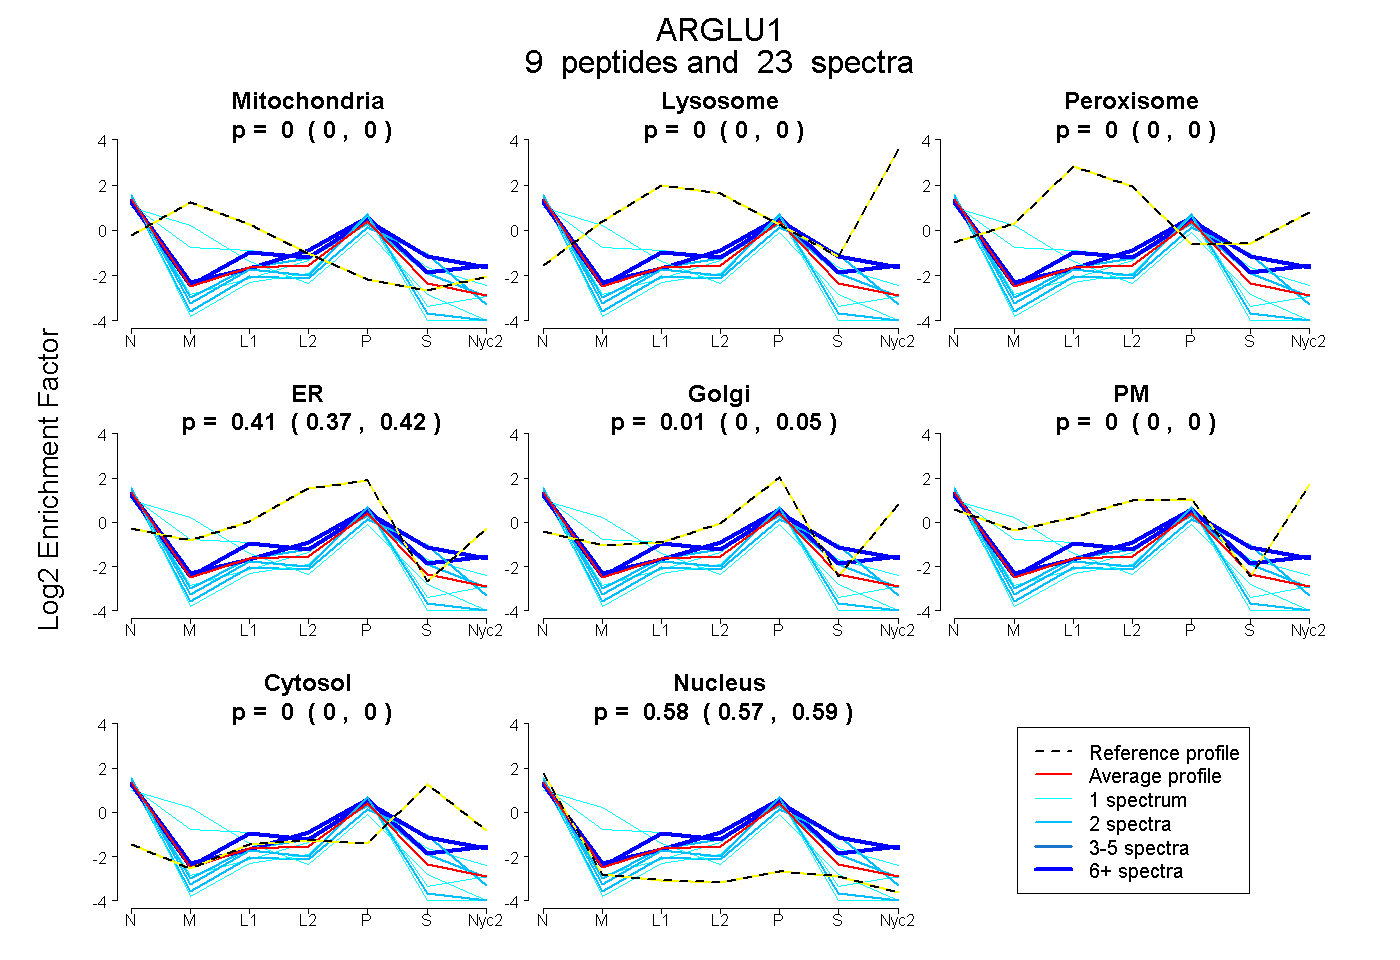
0.000 | 0.000
0.000 | 0.000
0.000 | 0.000
0.365 | 0.420
0.000 | 0.052
0.000 | 0.000
0.000 | 0.000
0.569 | 0.591
3peptides
spectra
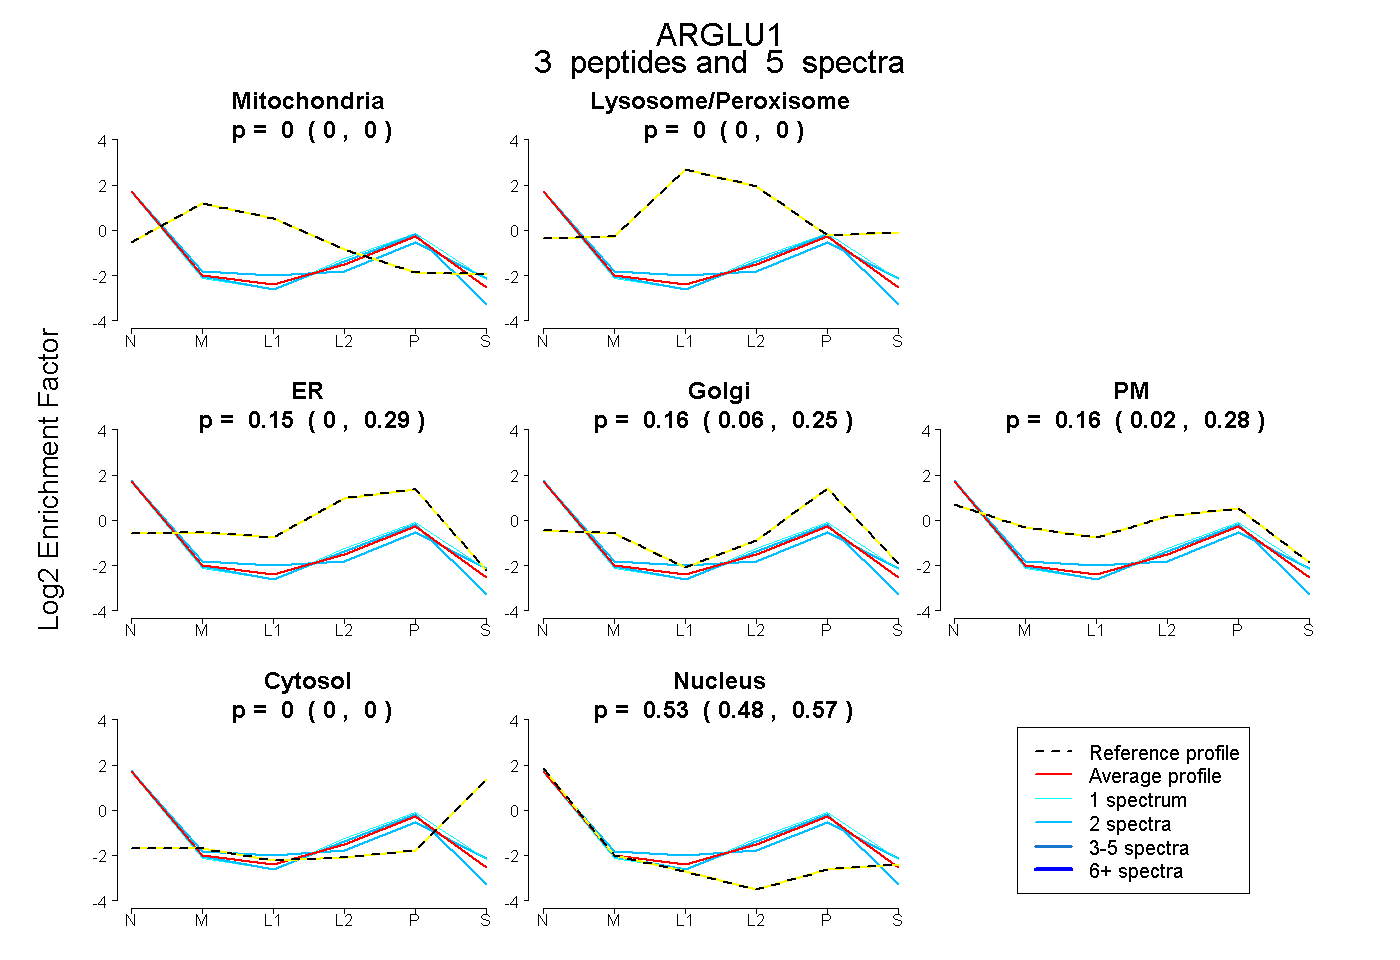
0.000 | 0.000
0.000 | 0.000
0.000 | 0.293
0.060 | 0.246
0.020 | 0.278
0.000 | 0.000
0.480 | 0.574
3peptides
spectra
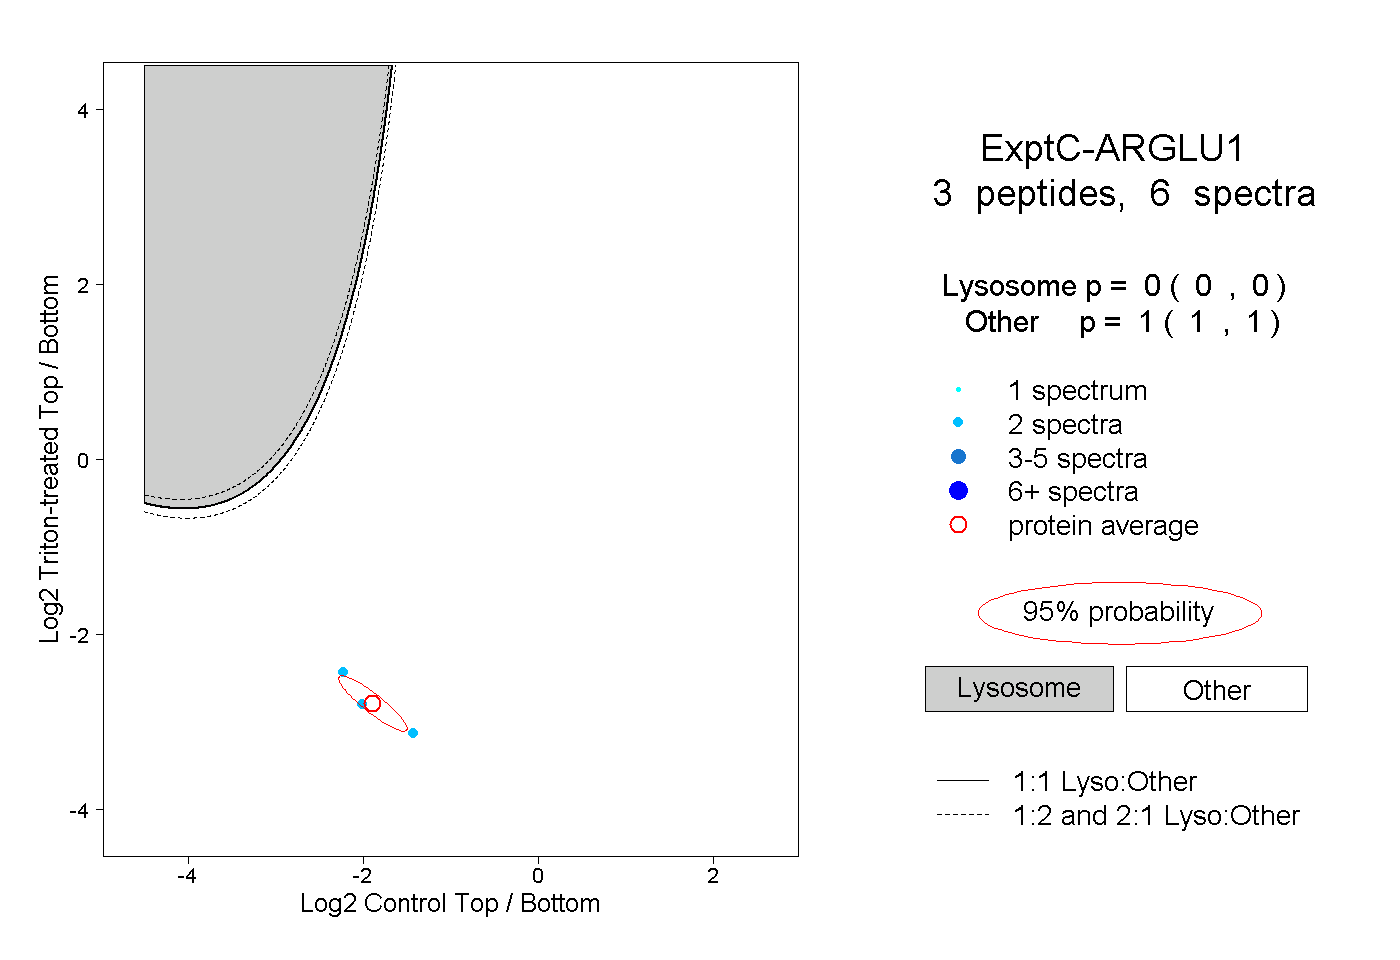
0.000 | 0.000
1.000 | 1.000