 9
9peptides
spectra
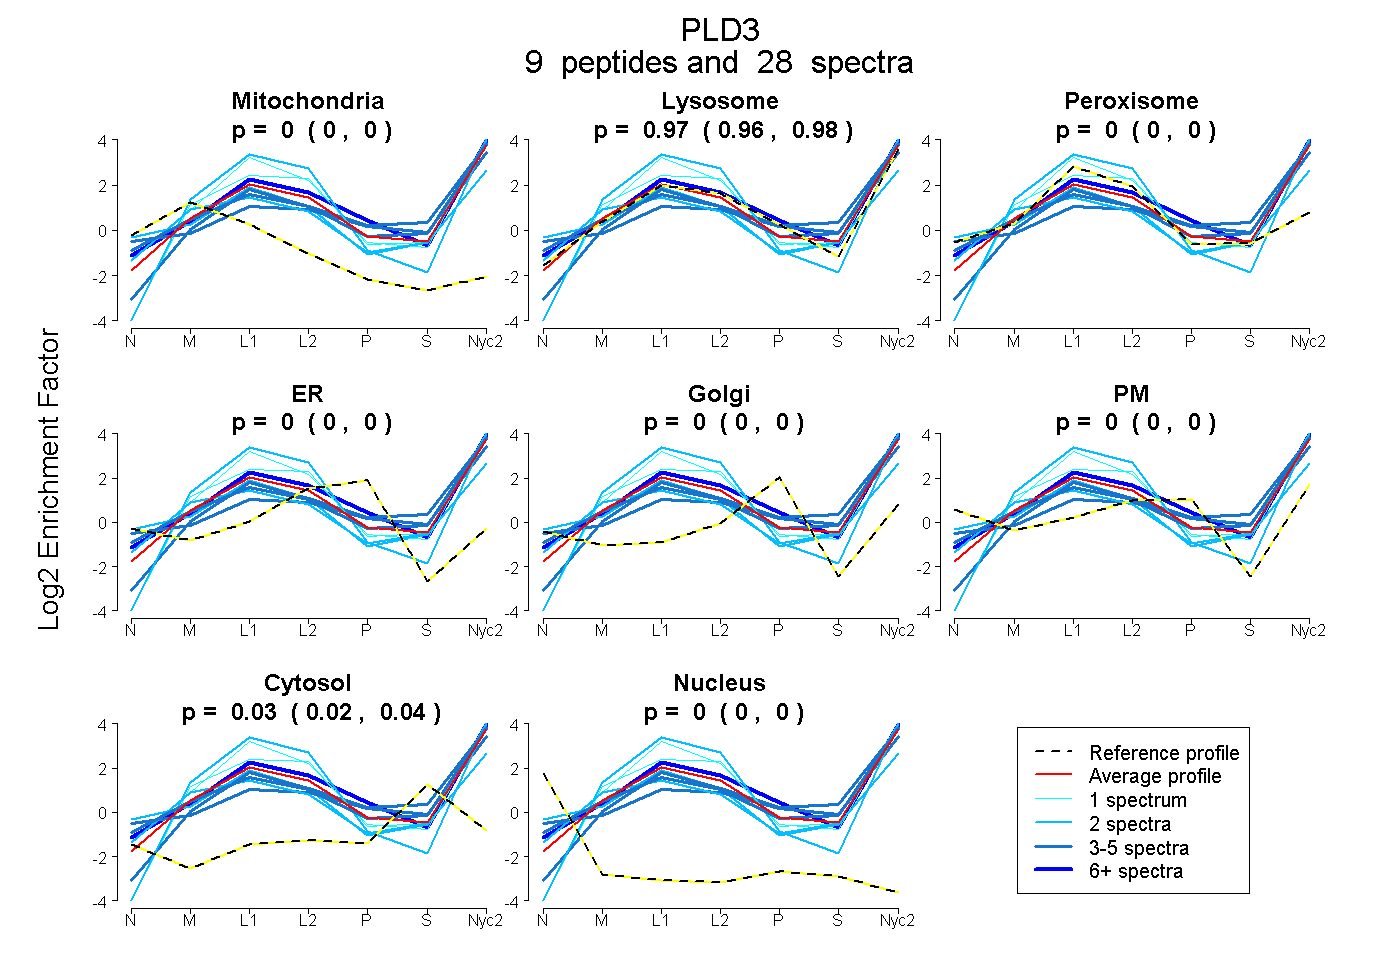
0.000 | 0.000
0.960 | 0.978
0.000 | 0.000
0.000 | 0.000
0.000 | 0.000
0.000 | 0.000
0.021 | 0.038
0.000 | 0.000
6peptides
spectra
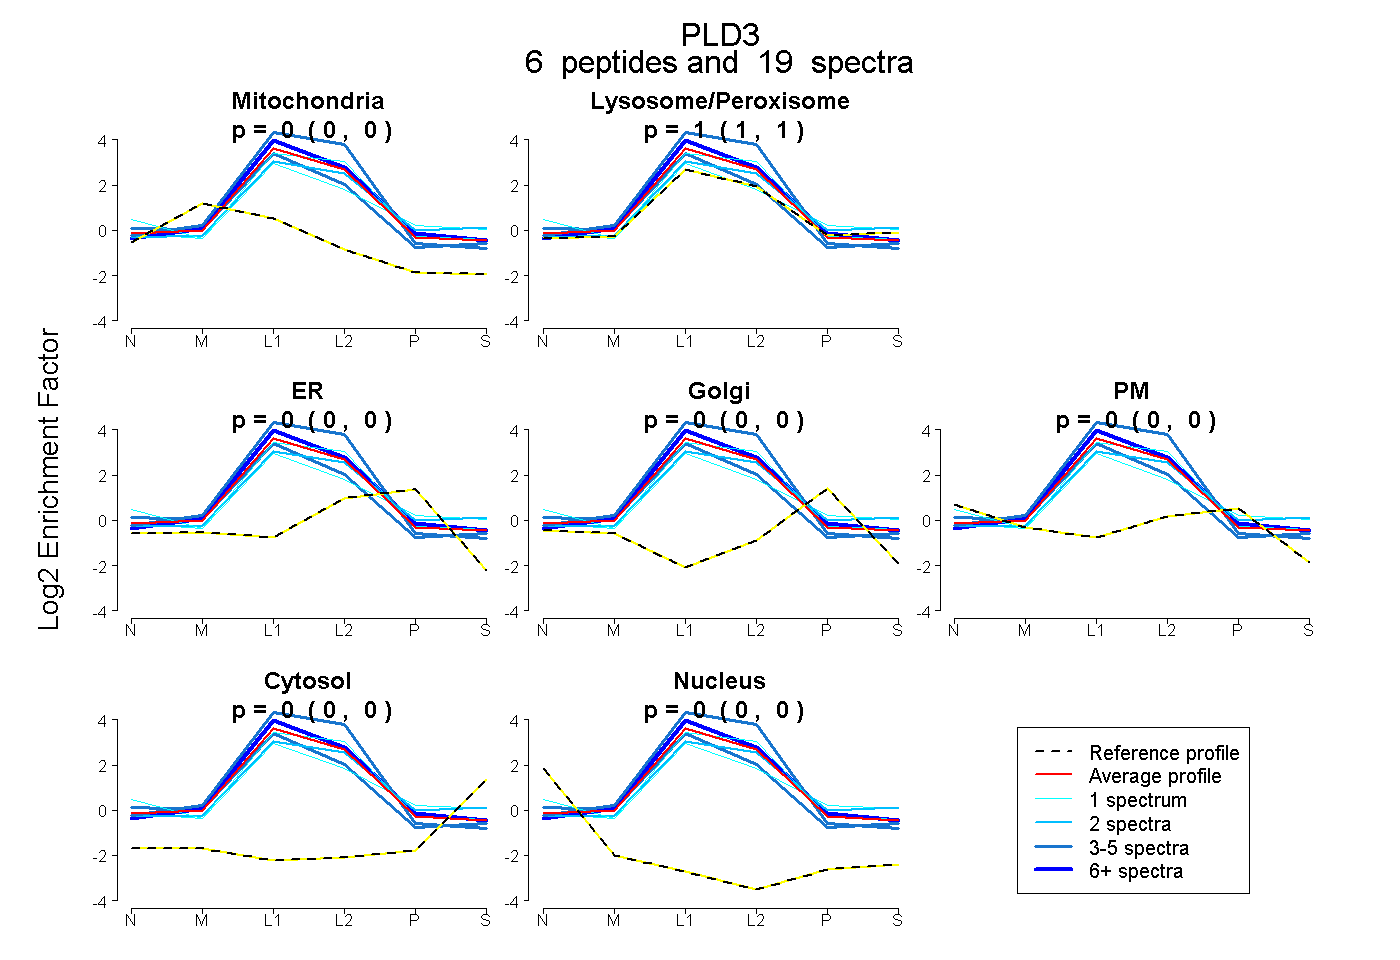
0.000 | 0.000
1.000 | 1.000
0.000 | 0.000
0.000 | 0.000
0.000 | 0.000
0.000 | 0.000
0.000 | 0.000
11peptides
spectra
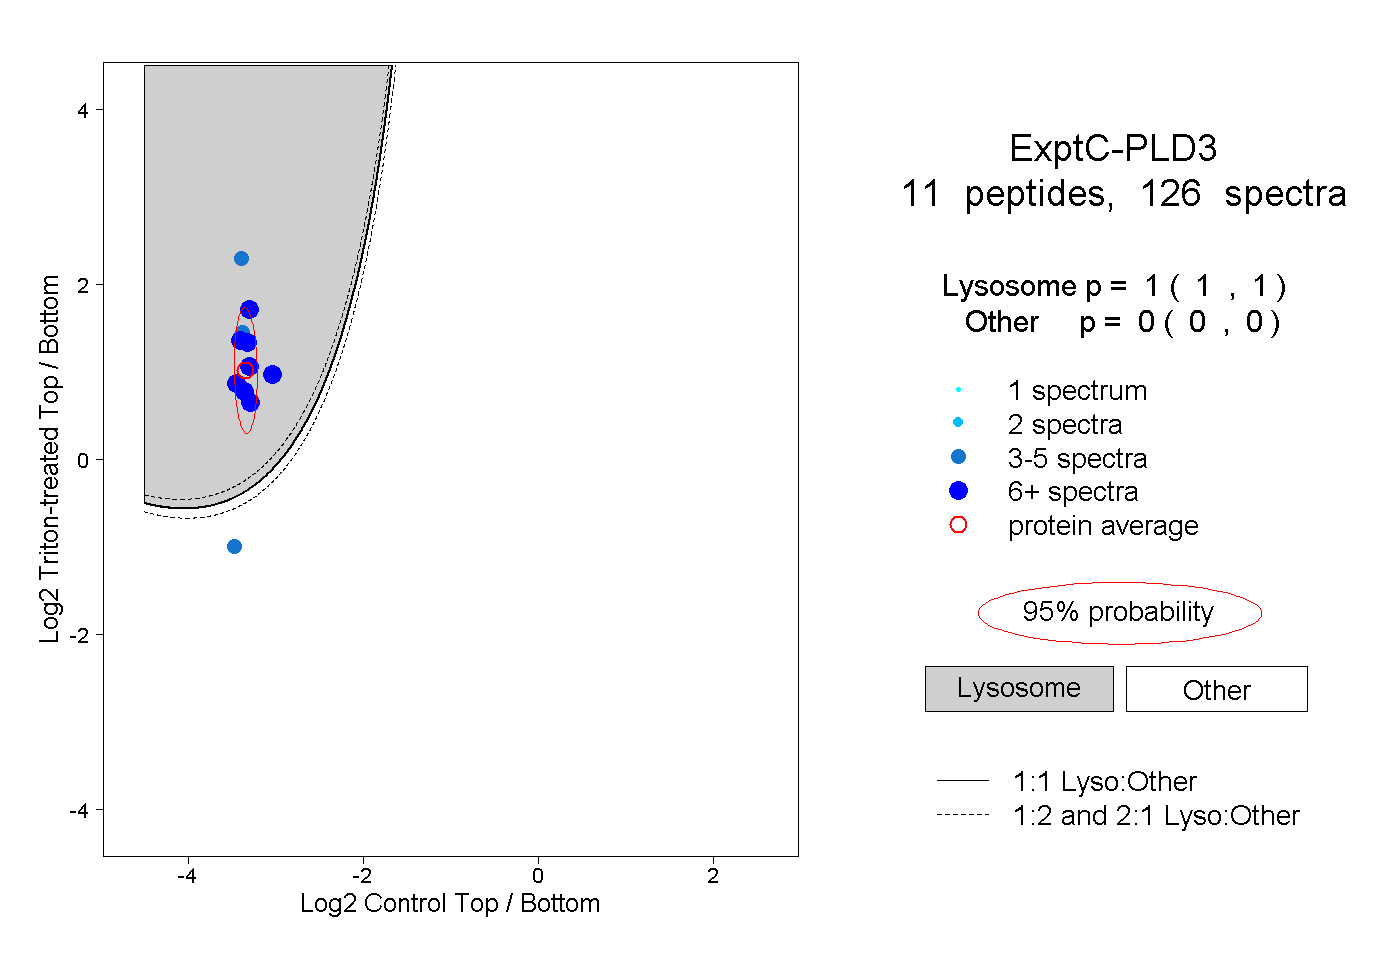
1.000 | 1.000
0.000 | 0.000
4peptides
spectra
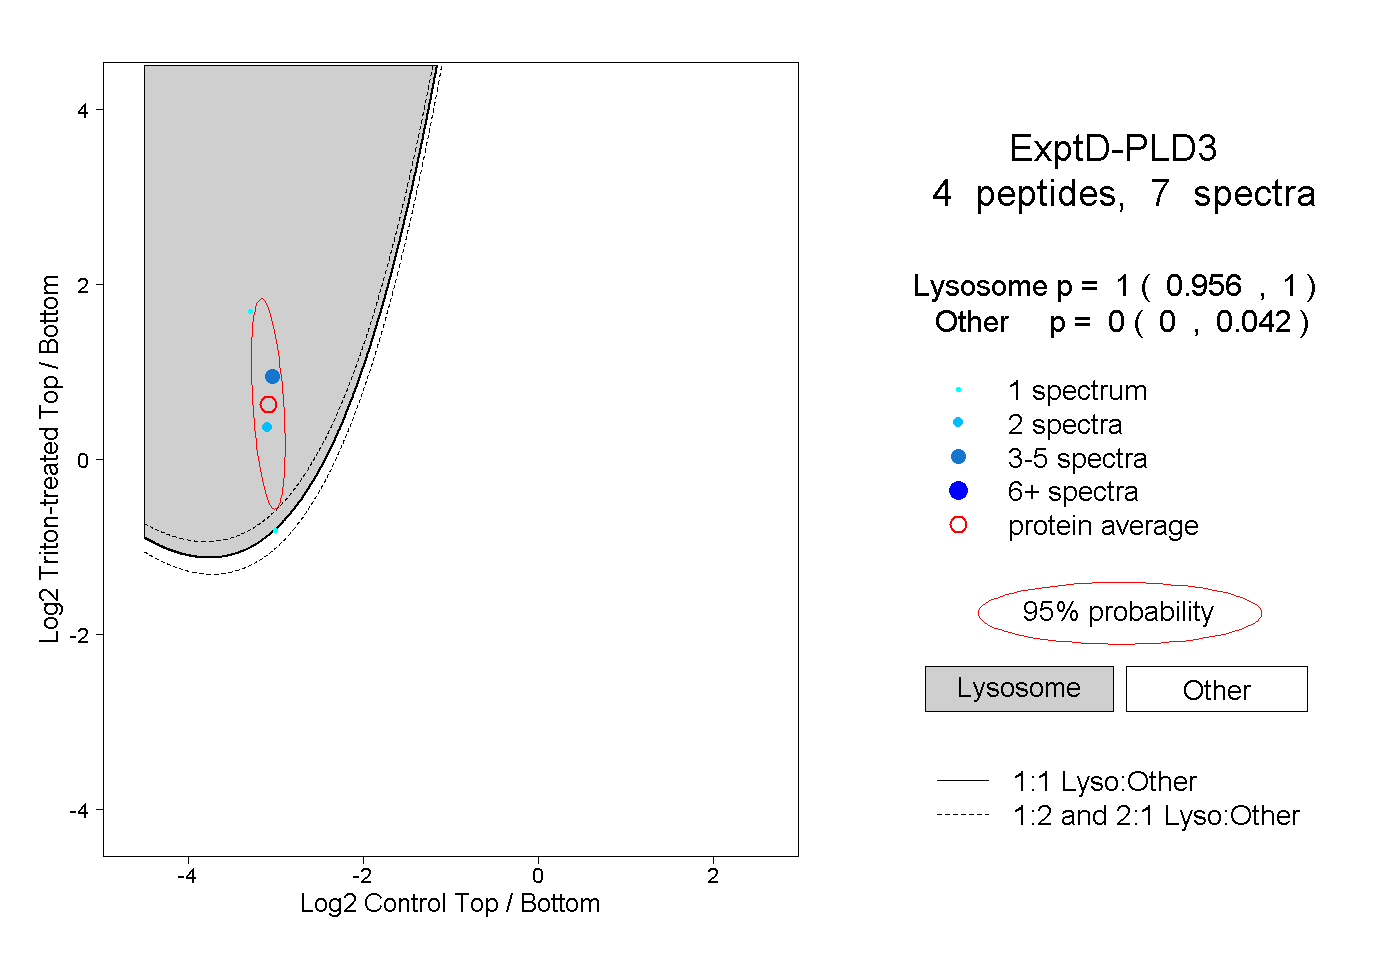
0.956 | 1.000
0.000 | 0.042