 9
9peptides
spectra
0.000 | 0.000
0.960 | 0.978
0.000 | 0.000
0.000 | 0.000
0.000 | 0.000
0.000 | 0.000
0.021 | 0.038
0.000 | 0.000
| Plot | Mito | Lyso | Perox | ER | Golgi | PM | Cytosol | Nucleus | |||||
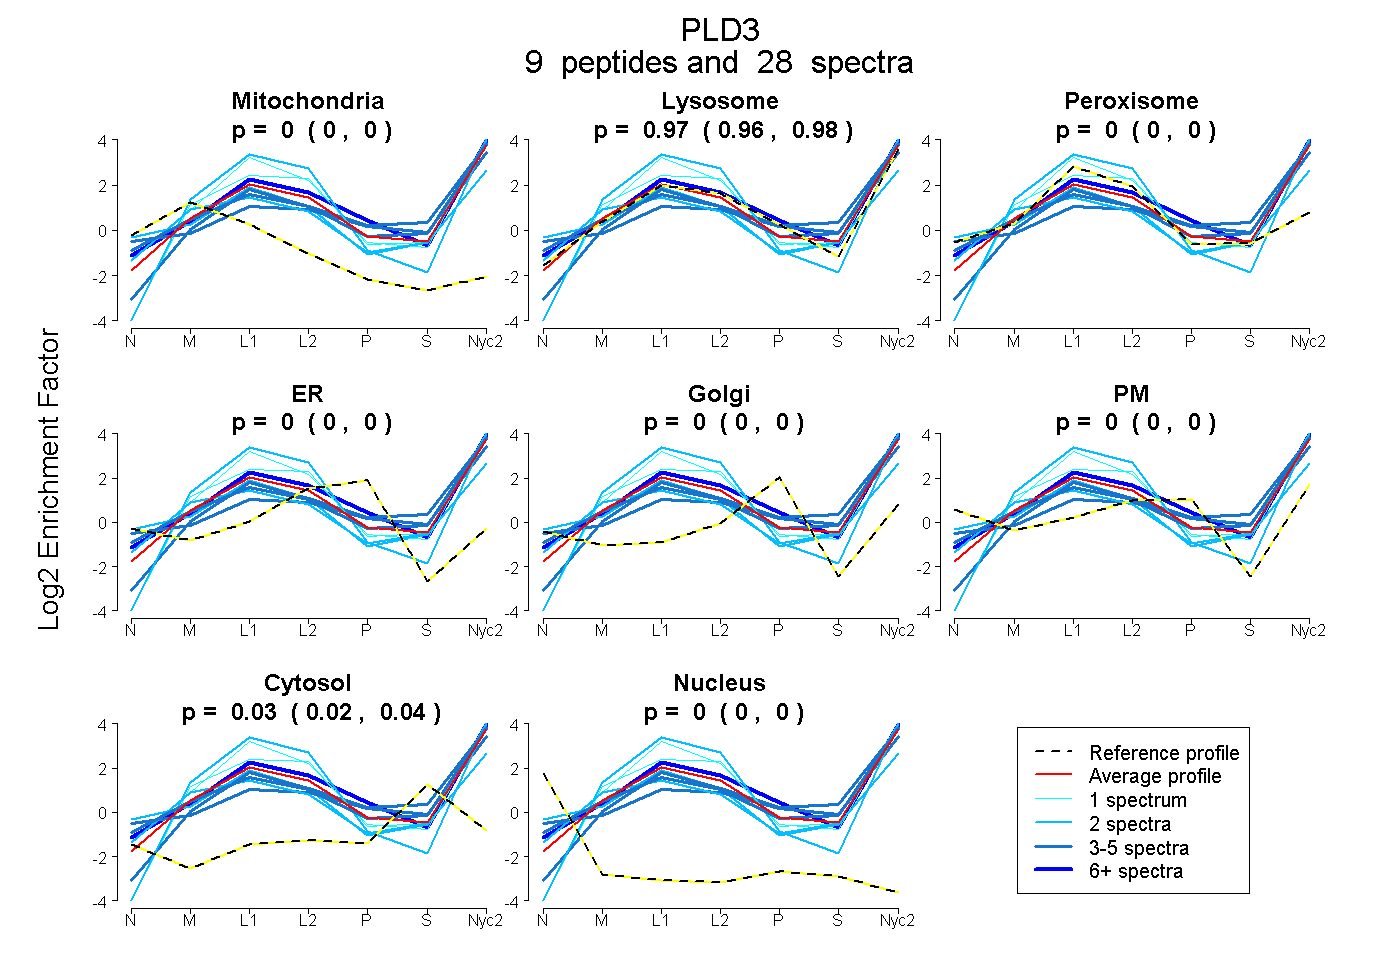
| Expt A |
9 peptides |
28 spectra |
|
0.000 0.000 | 0.000 |
0.970 0.960 | 0.978 |
0.000 0.000 | 0.000 |
0.000 0.000 | 0.000 |
0.000 0.000 | 0.000 |
0.000 0.000 | 0.000 |
0.030 0.021 | 0.038 |
0.000 0.000 | 0.000 |
| 5 spectra, MVDMQK | 0.000 | 0.899 | 0.000 | 0.000 | 0.000 | 0.000 | 0.101 | 0.000 | ||
| 9 spectra, ALLSVVDNAR | 0.000 | 1.000 | 0.000 | 0.000 | 0.000 | 0.000 | 0.000 | 0.000 | ||
| 1 spectrum, SLTQVK | 0.000 | 0.902 | 0.098 | 0.000 | 0.000 | 0.000 | 0.000 | 0.000 | ||
| 2 spectra, SQLEAVFLR | 0.021 | 0.916 | 0.000 | 0.000 | 0.000 | 0.000 | 0.063 | 0.000 | ||
| 3 spectra, LTHGVLHTK | 0.000 | 0.751 | 0.000 | 0.000 | 0.000 | 0.093 | 0.156 | 0.000 | ||
| 2 spectra, LLISCWGHSEPSMR | 0.000 | 0.577 | 0.331 | 0.000 | 0.000 | 0.000 | 0.033 | 0.060 | ||
| 3 spectra, YMVTER | 0.000 | 0.911 | 0.000 | 0.000 | 0.000 | 0.000 | 0.089 | 0.000 | ||
| 2 spectra, SFLLSLAALR | 0.000 | 1.000 | 0.000 | 0.000 | 0.000 | 0.000 | 0.000 | 0.000 | ||
| 1 spectrum, FWPAIDDGLR | 0.000 | 1.000 | 0.000 | 0.000 | 0.000 | 0.000 | 0.000 | 0.000 |
| Plot | Mito | Lyso or Perox | ER | Golgi | PM | Cytosol | Nucleus | ||||||
| Expt B |
6 peptides |
19 spectra |
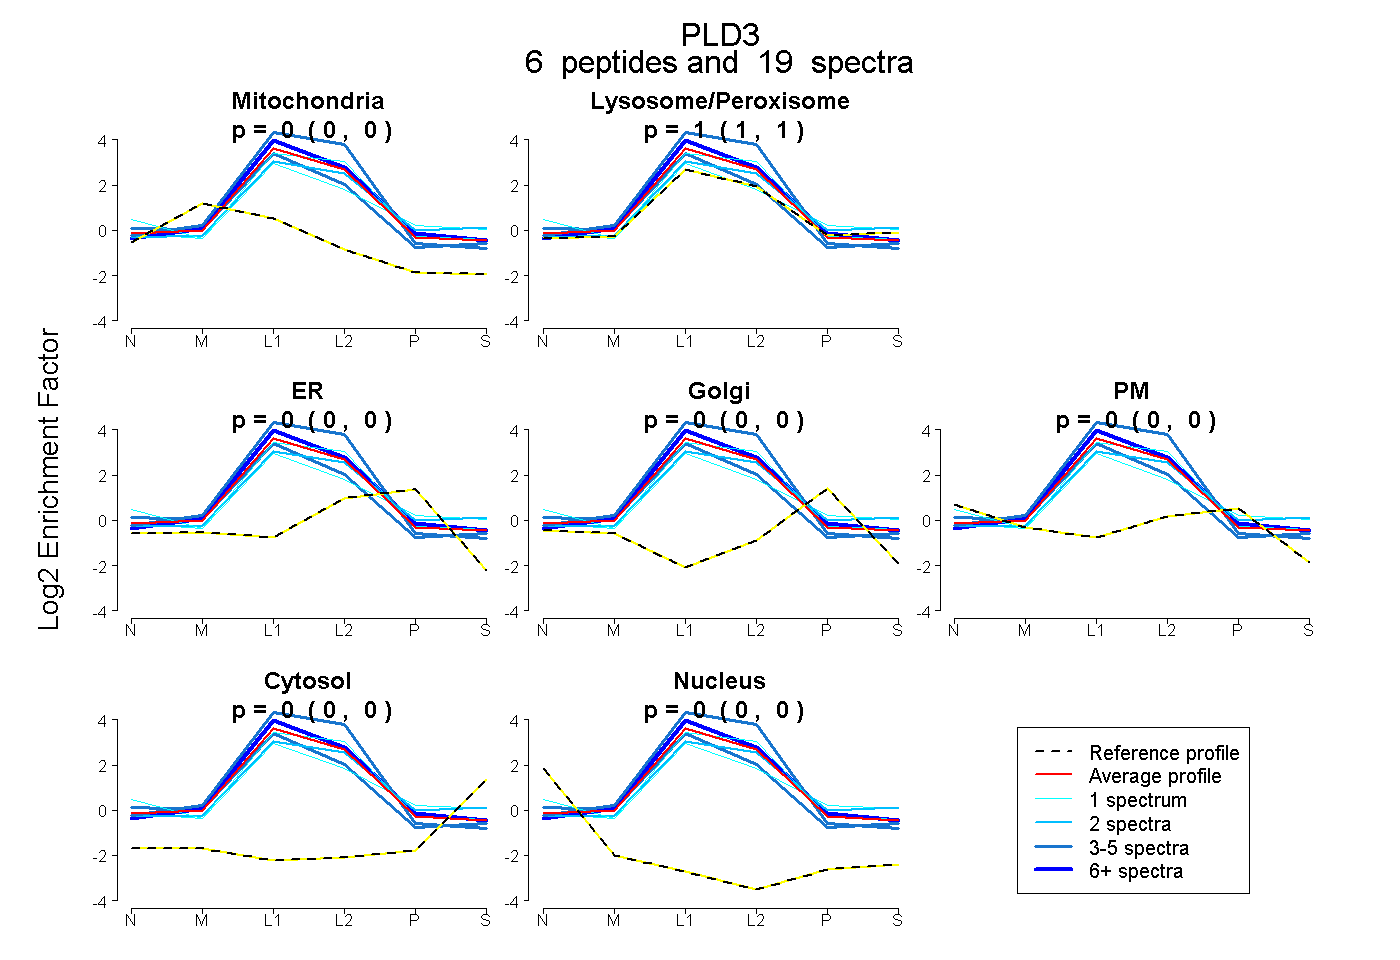 |
0.000 0.000 | 0.000 |
1.000 1.000 | 1.000 |
0.000 0.000 | 0.000 |
0.000 0.000 | 0.000 |
0.000 0.000 | 0.000 |
0.000 0.000 | 0.000 |
0.000 0.000 | 0.000 |
|||
| Plot | Lyso | Other | |||||||||||
| Expt C |
11 peptides |
126 spectra |
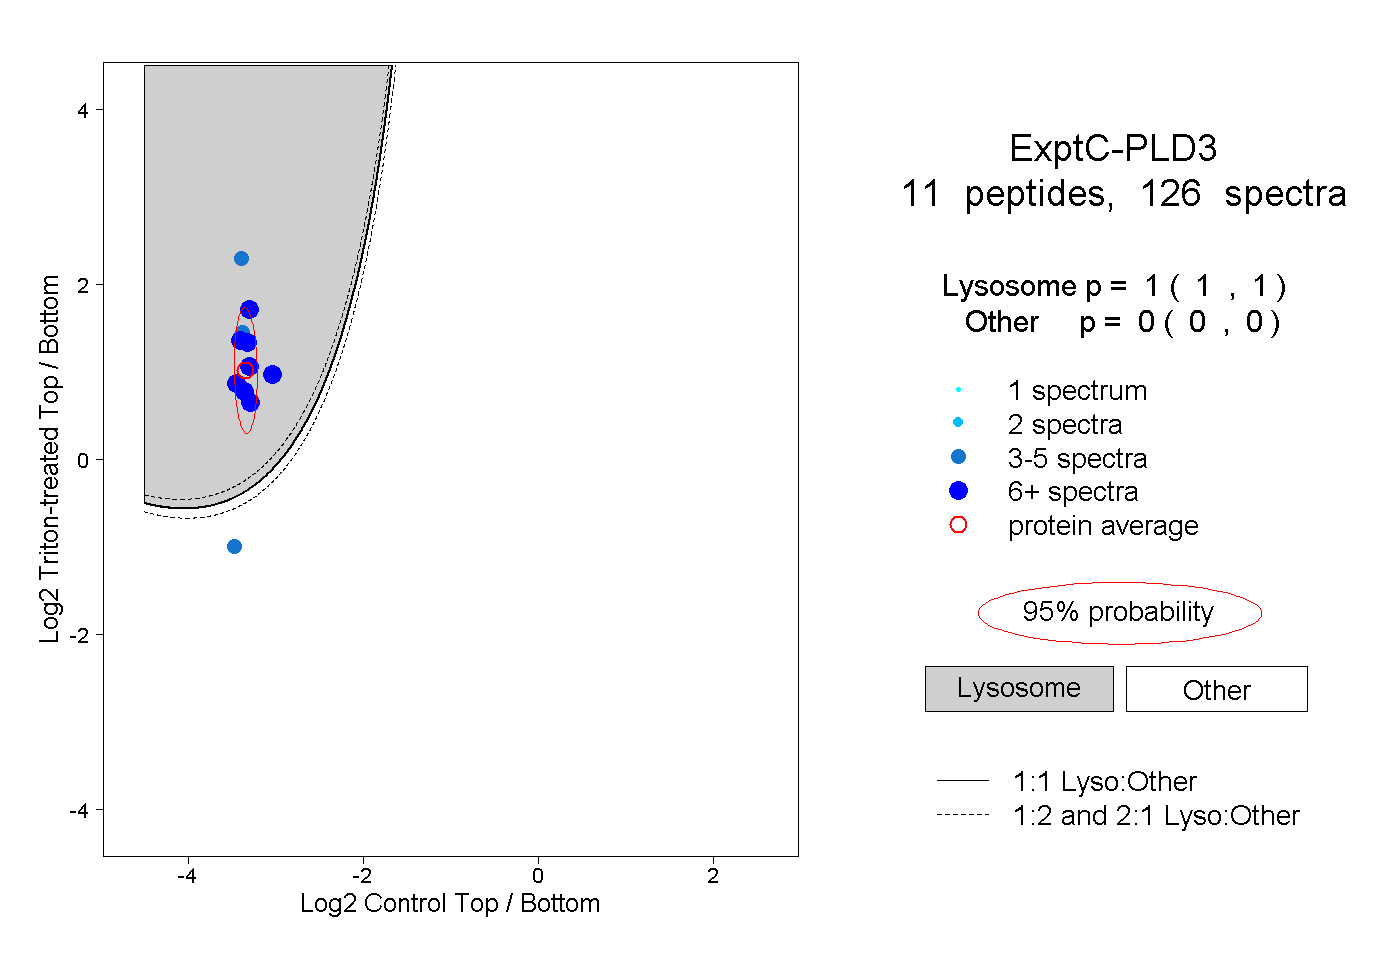 |
1.000 1.000 | 1.000 |
0.000 0.000 | 0.000 |
||||||||
| Plot | Lyso | Other | |||||||||||
| Expt D |
4 peptides |
7 spectra |
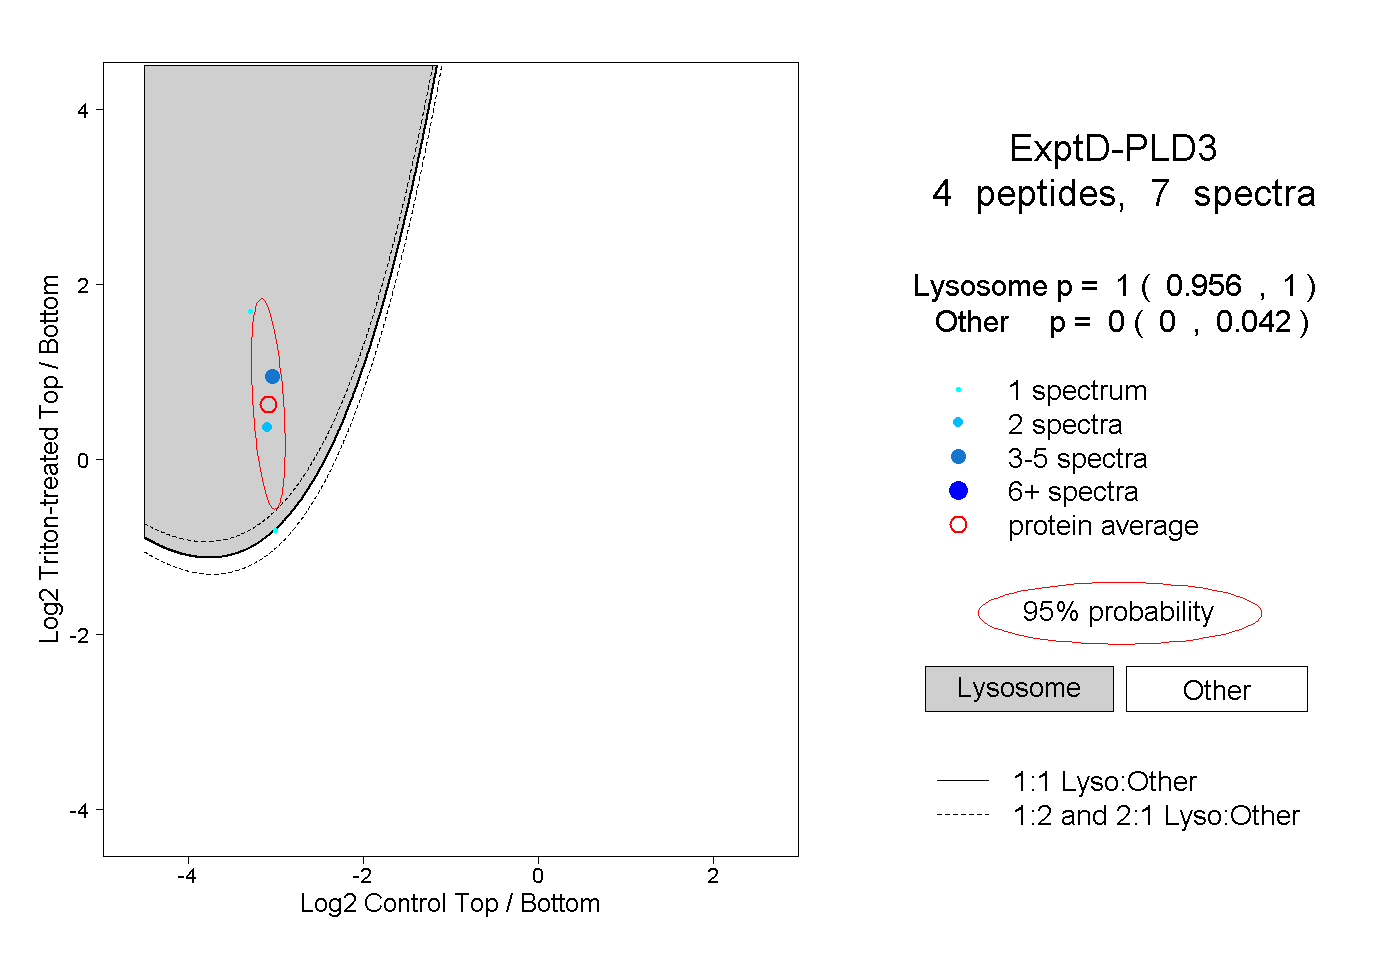 |
1.000 0.956 | 1.000 |
0.000 0.000 | 0.042 |