 17
17peptides
spectra
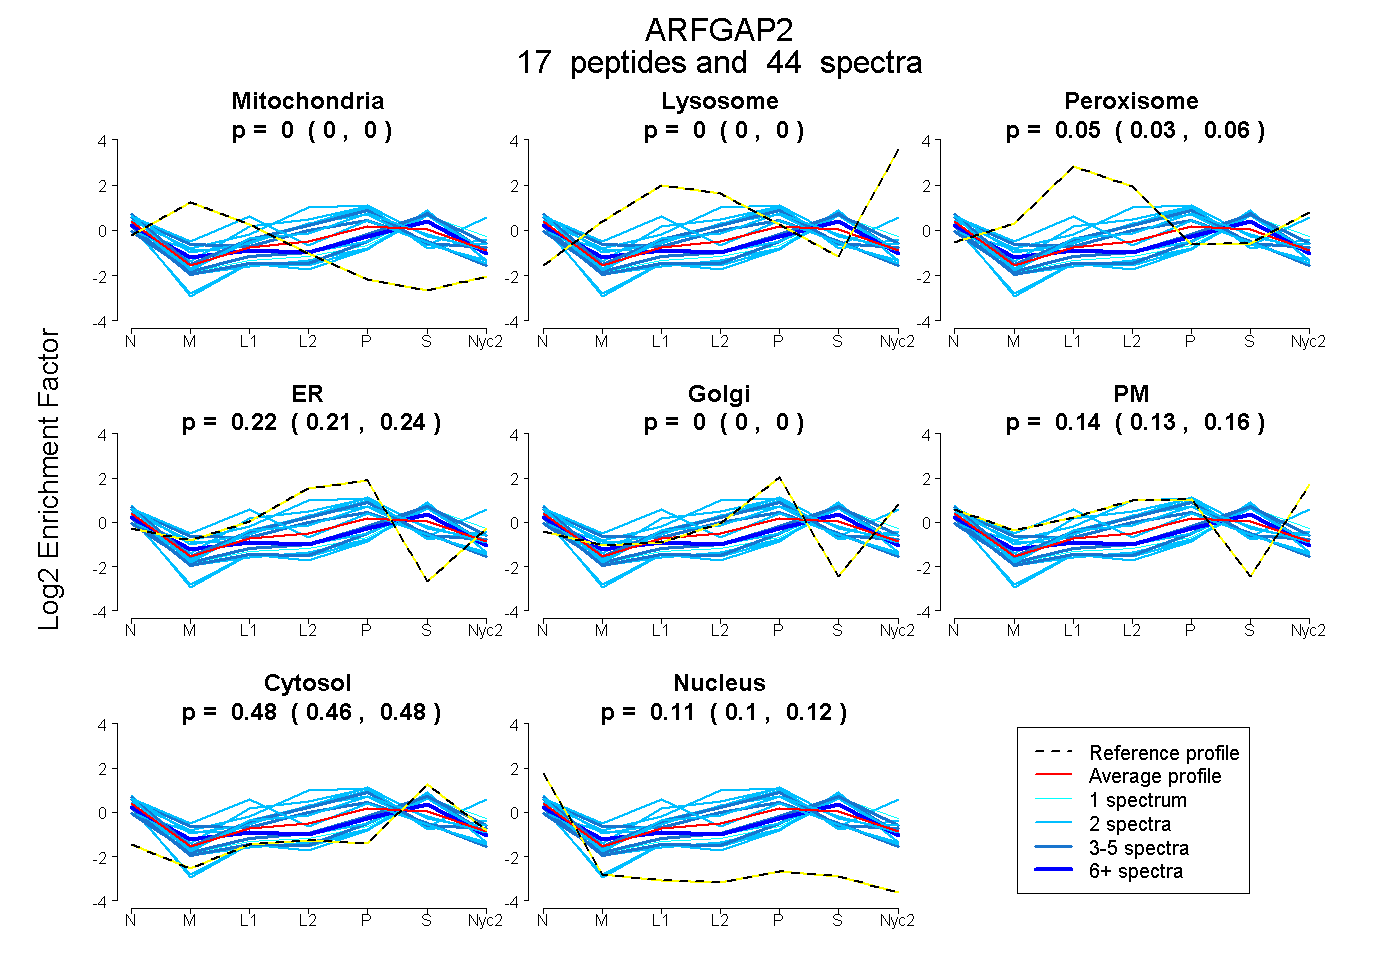
0.000 | 0.000
0.000 | 0.000
0.032 | 0.059
0.206 | 0.241
0.000 | 0.000
0.126 | 0.158
0.465 | 0.484
0.101 | 0.116
5peptides
spectra
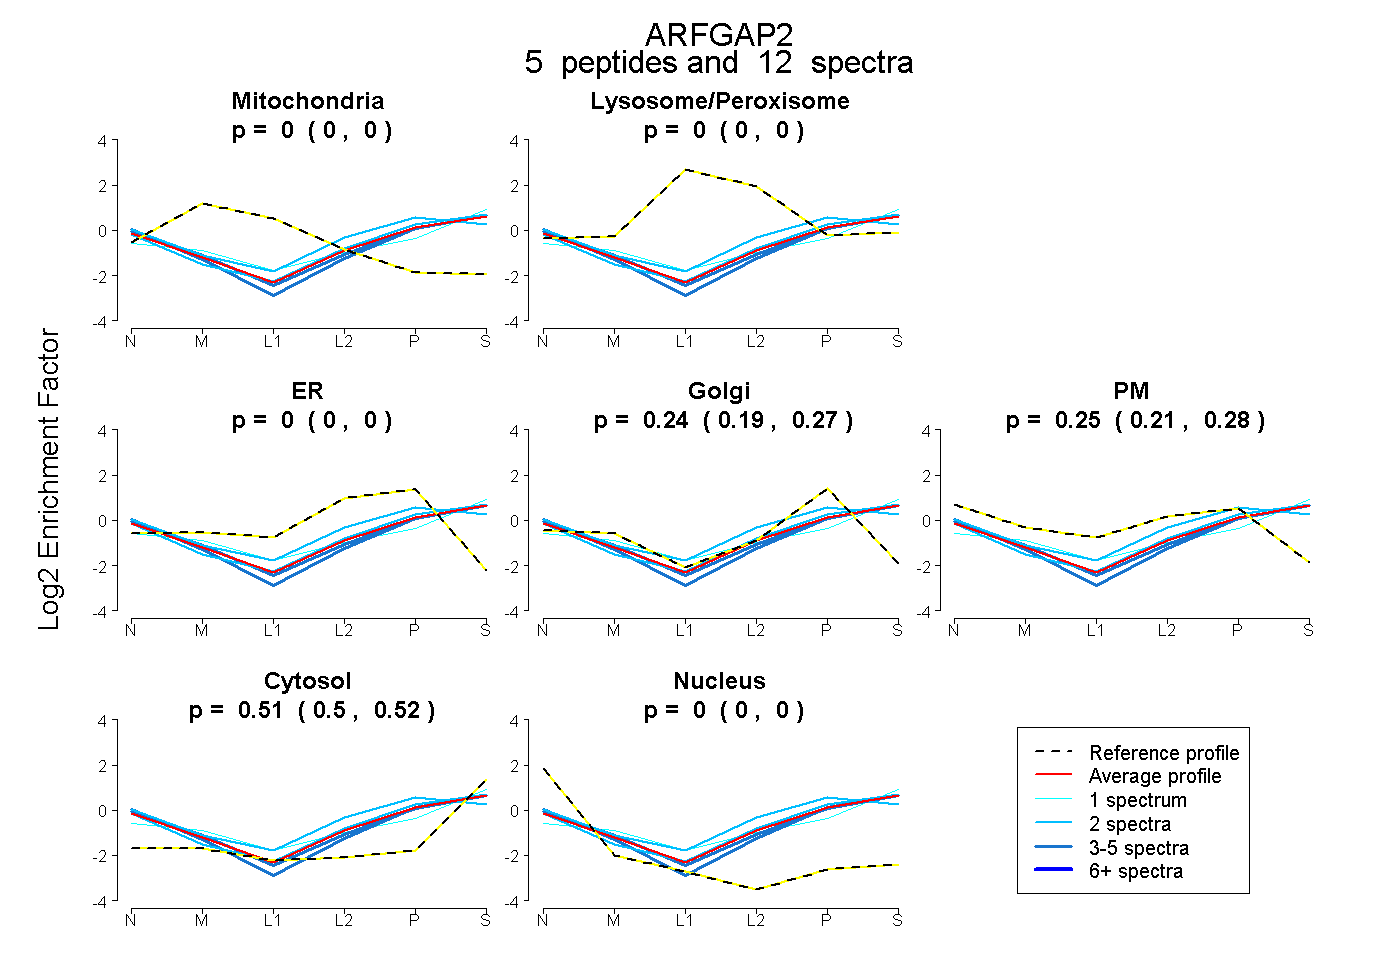
0.000 | 0.000
0.000 | 0.000
0.000 | 0.000
0.193 | 0.272
0.213 | 0.285
0.498 | 0.525
0.000 | 0.000
14peptides
spectra
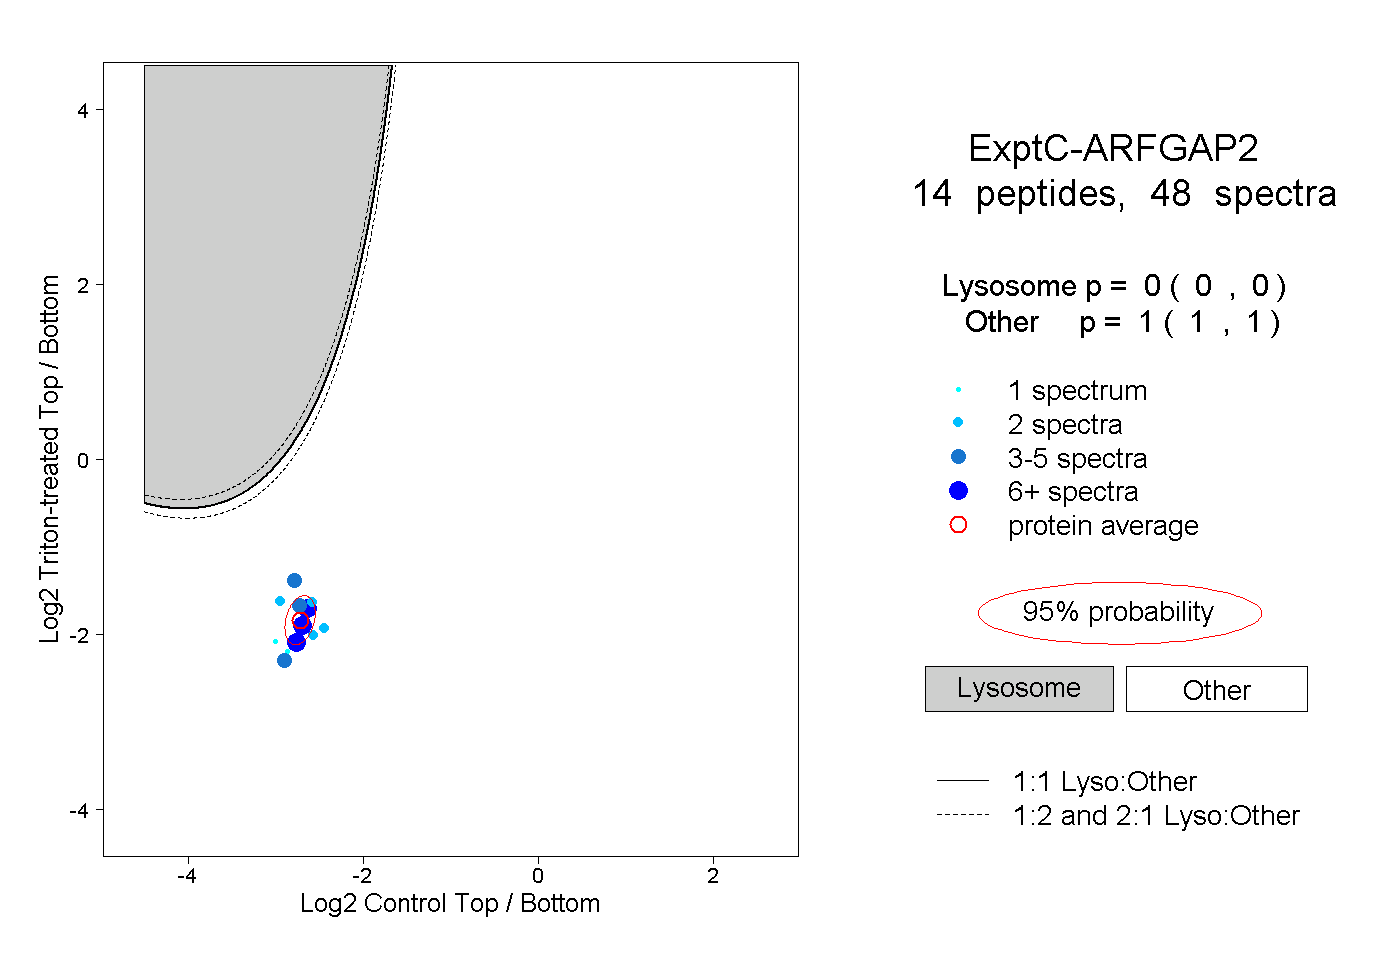
0.000 | 0.000
1.000 | 1.000
5peptides
spectra
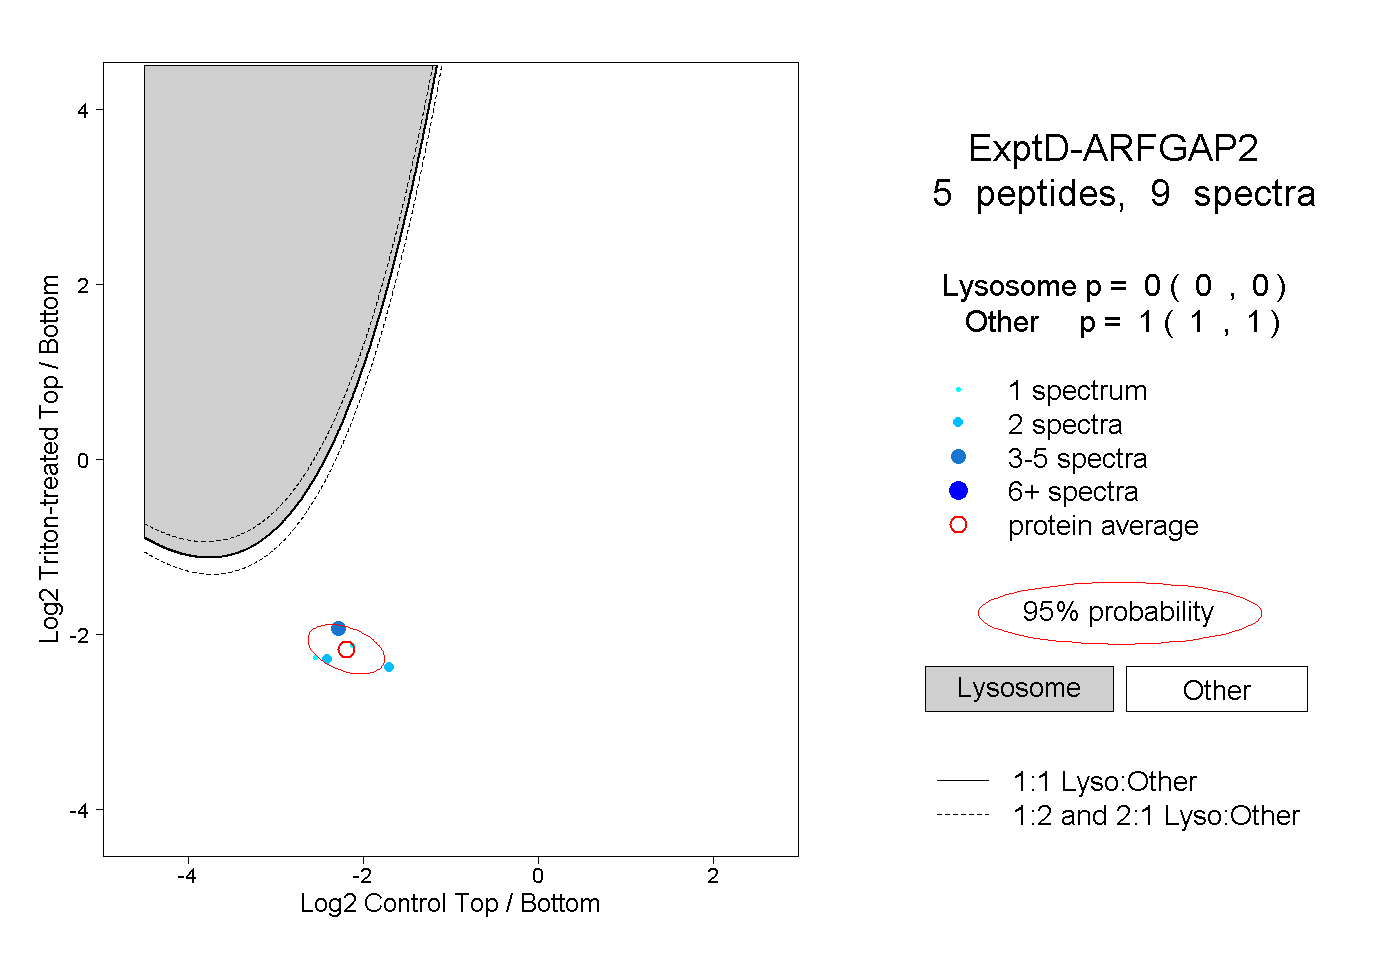
0.000 | 0.000
1.000 | 1.000