 11
11peptides
spectra
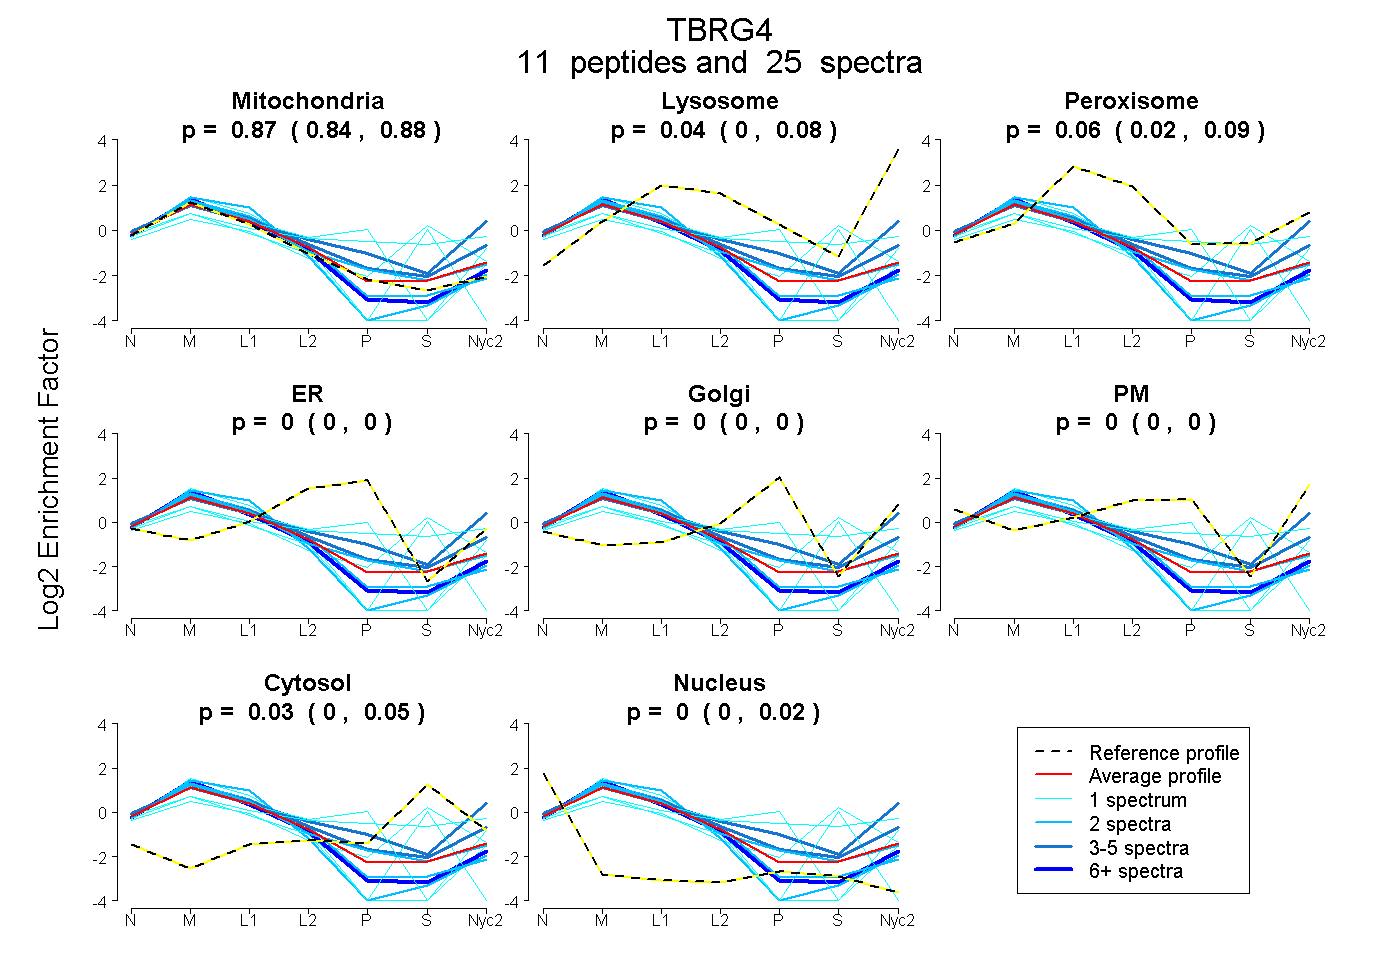
0.836 | 0.881
0.004 | 0.083
0.023 | 0.090
0.000 | 0.000
0.000 | 0.000
0.000 | 0.000
0.003 | 0.049
0.000 | 0.016
7peptides
spectra
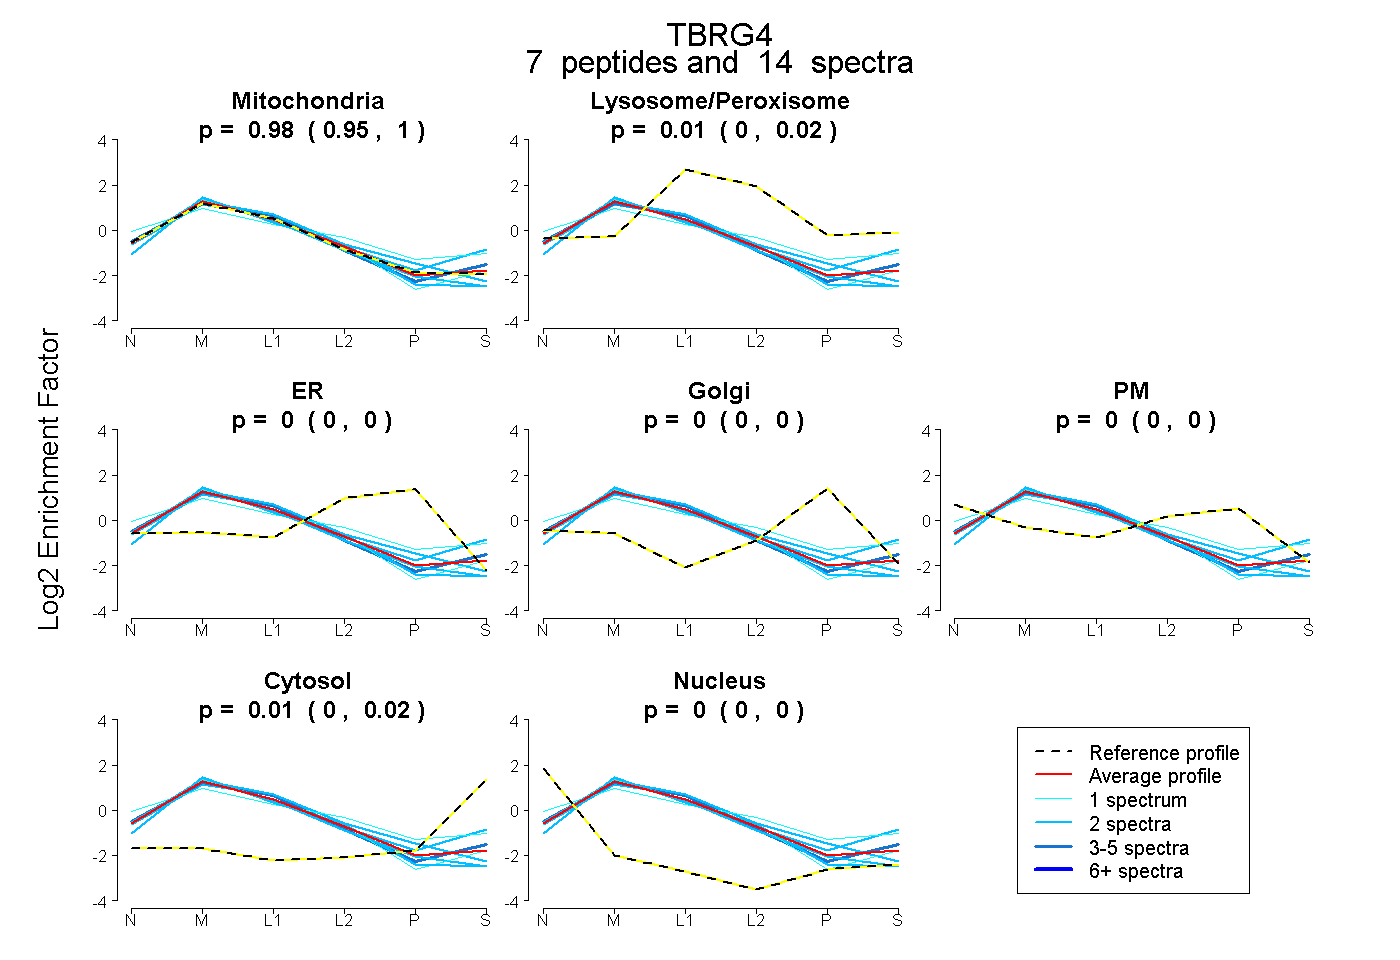
0.952 | 0.999
0.000 | 0.022
0.000 | 0.000
0.000 | 0.000
0.000 | 0.000
0.000 | 0.023
0.000 | 0.000
20peptides
spectra
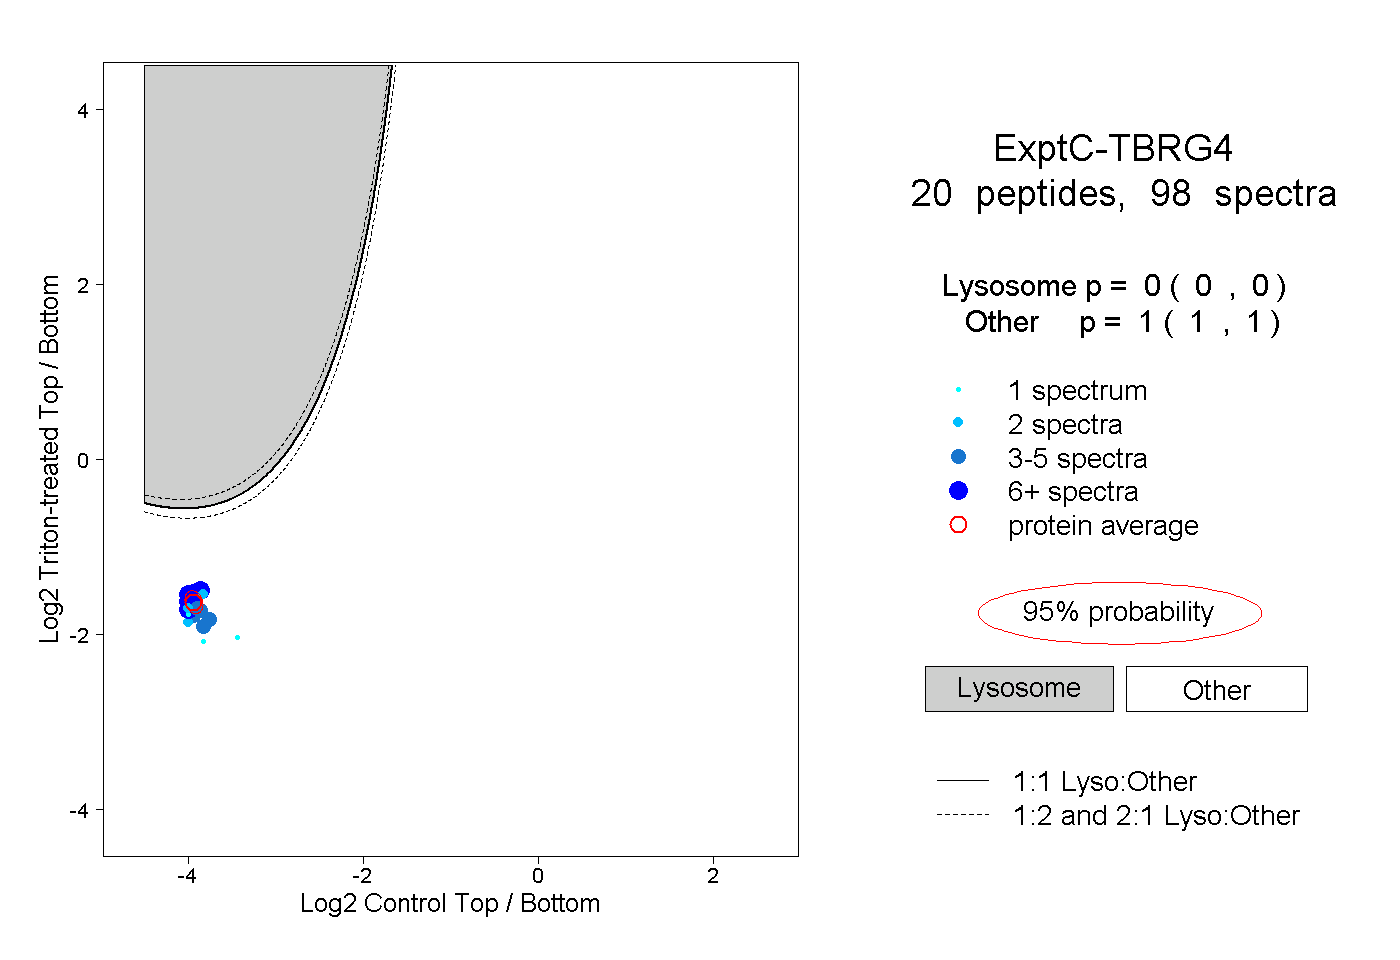
0.000 | 0.000
1.000 | 1.000
7peptides
spectra
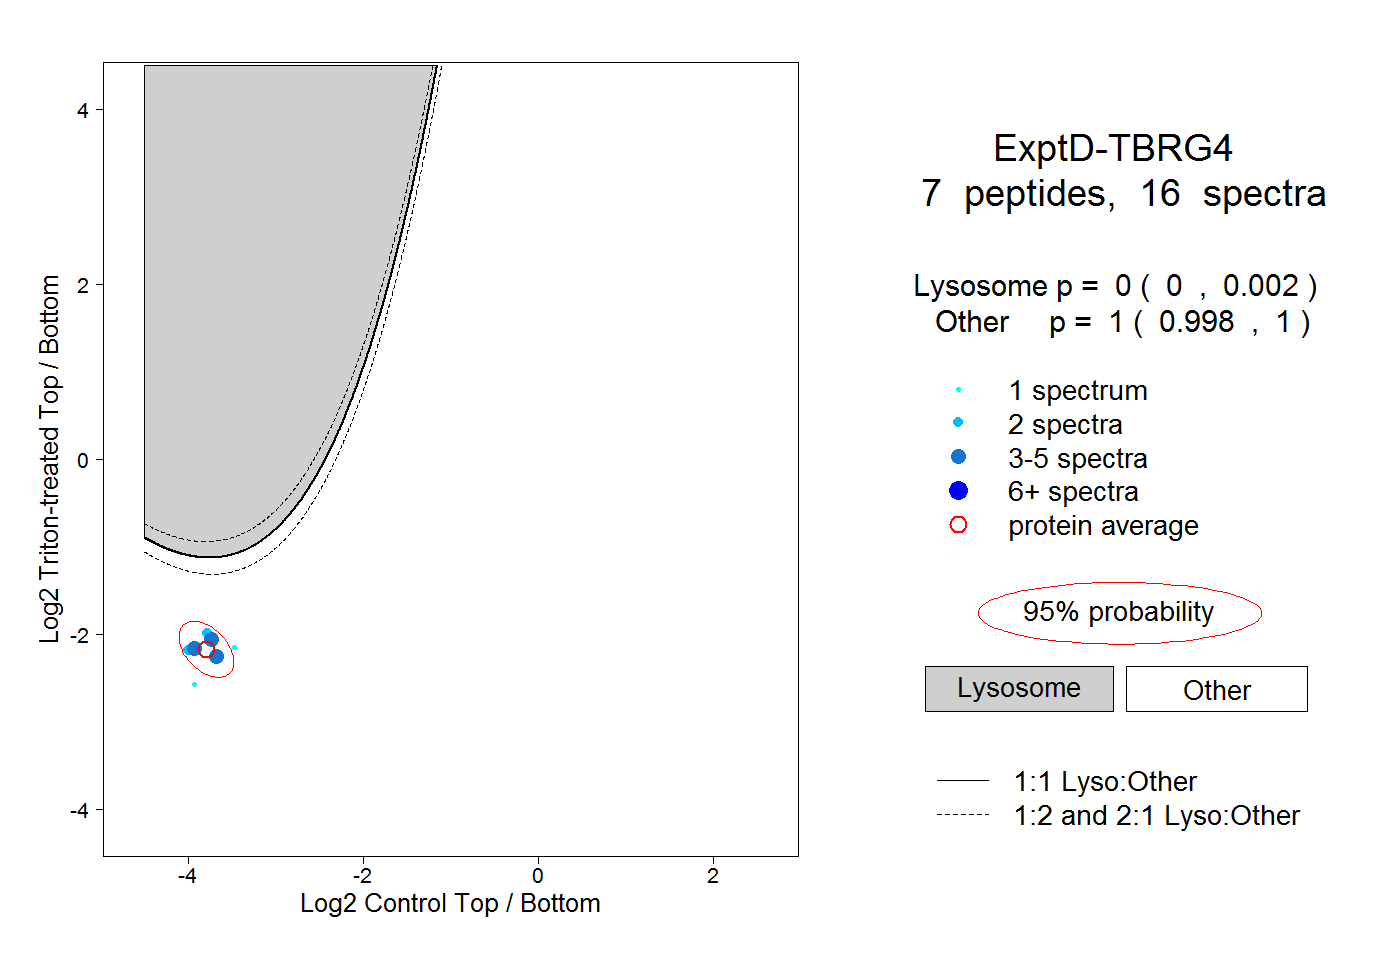
0.000 | 0.002
0.998 | 1.000