 44
44peptides
spectra
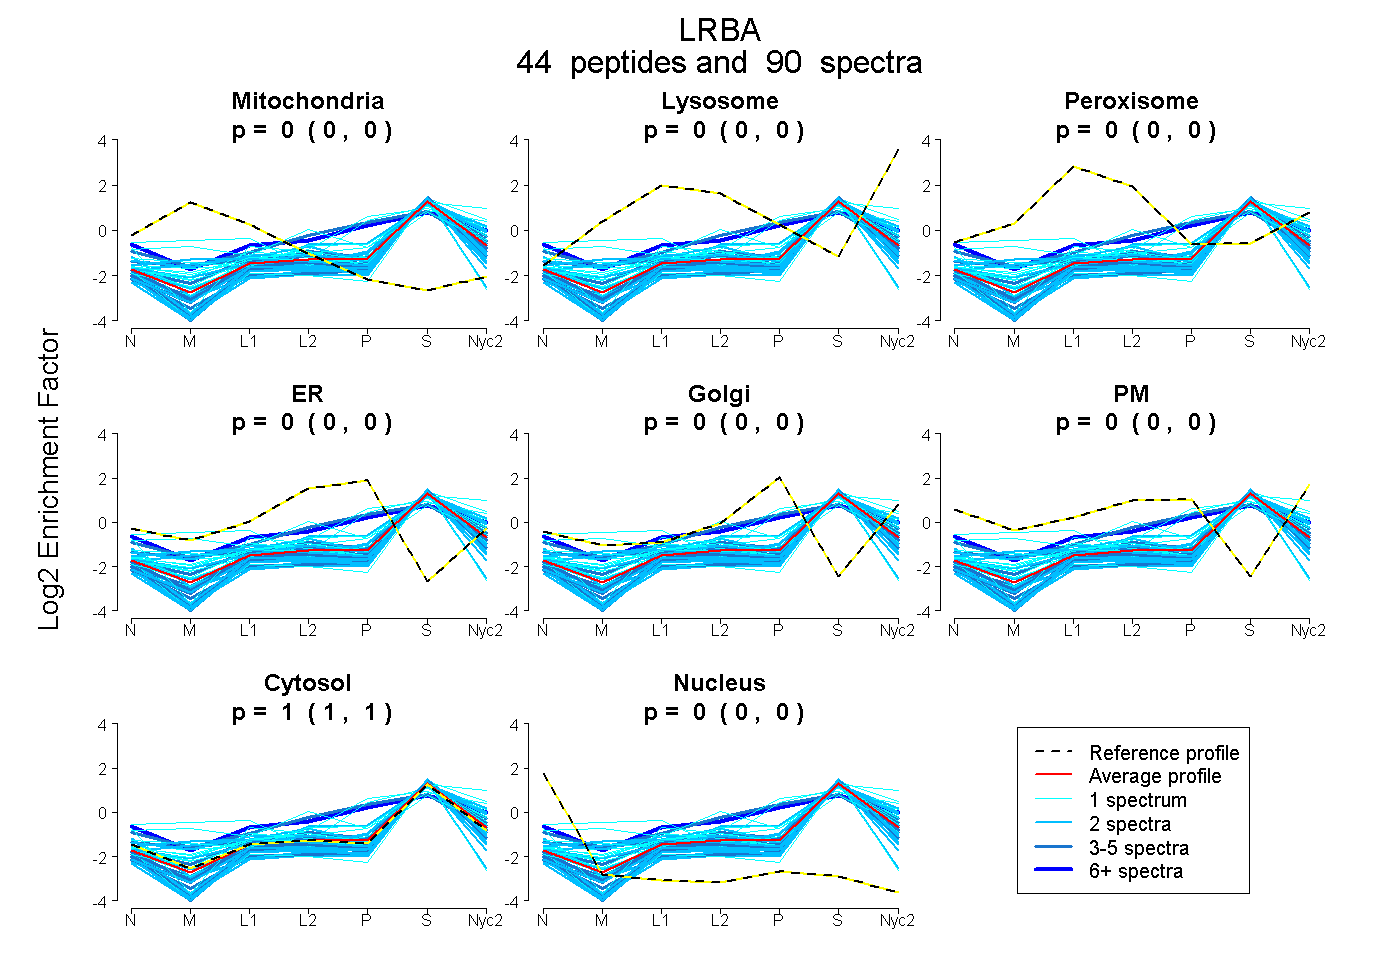
0.000 | 0.000
0.000 | 0.004
0.000 | 0.000
0.000 | 0.000
0.000 | 0.000
0.000 | 0.000
0.996 | 1.000
0.000 | 0.000
12peptides
spectra
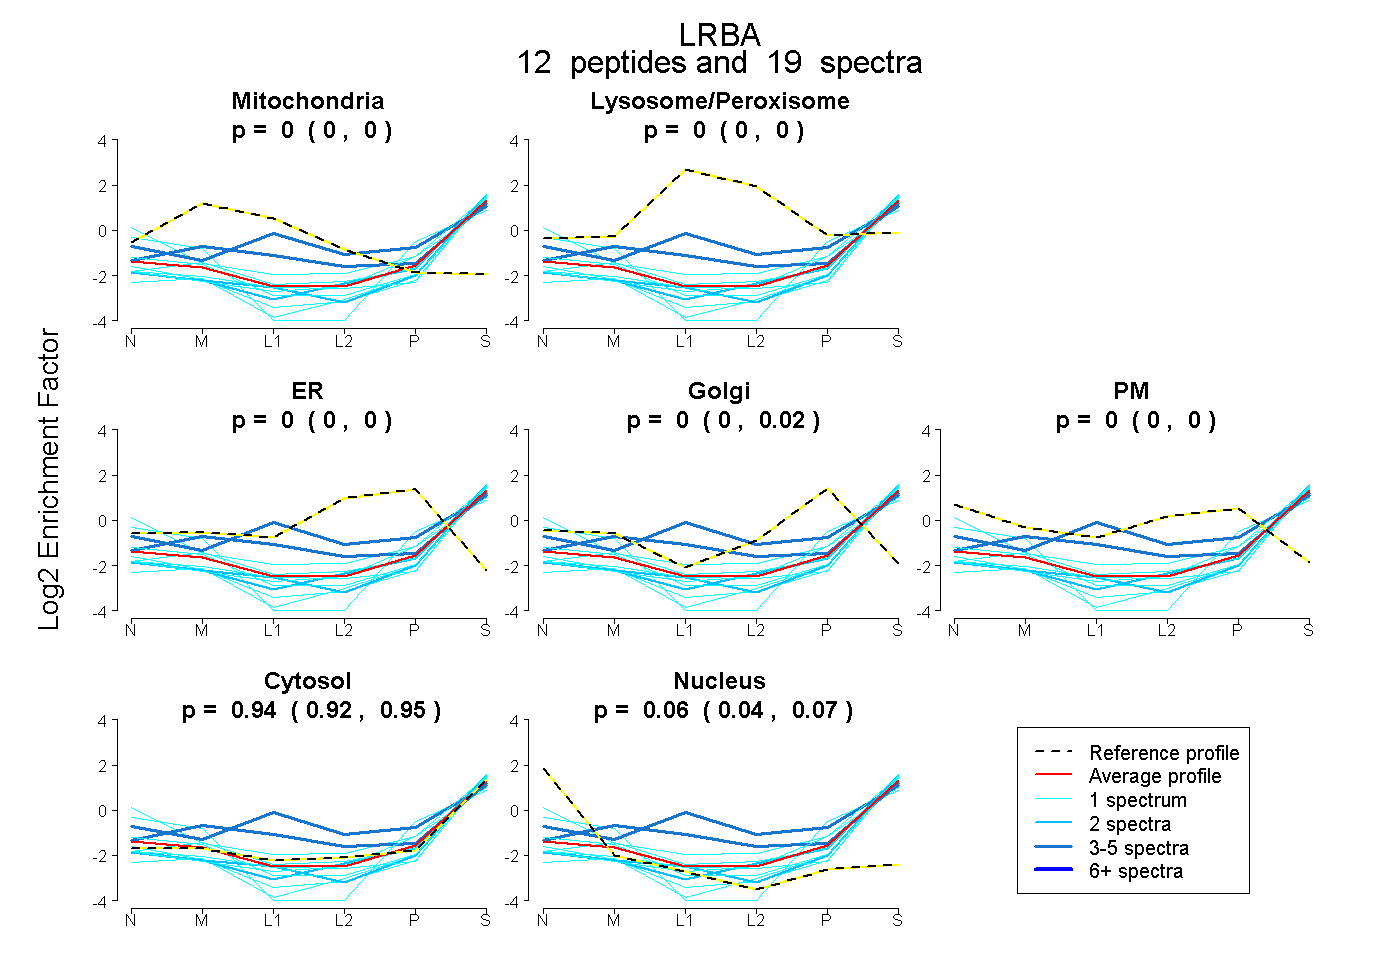
0.000 | 0.000
0.000 | 0.000
0.000 | 0.000
0.000 | 0.016
0.000 | 0.000
0.925 | 0.948
0.042 | 0.070
24peptides
spectra
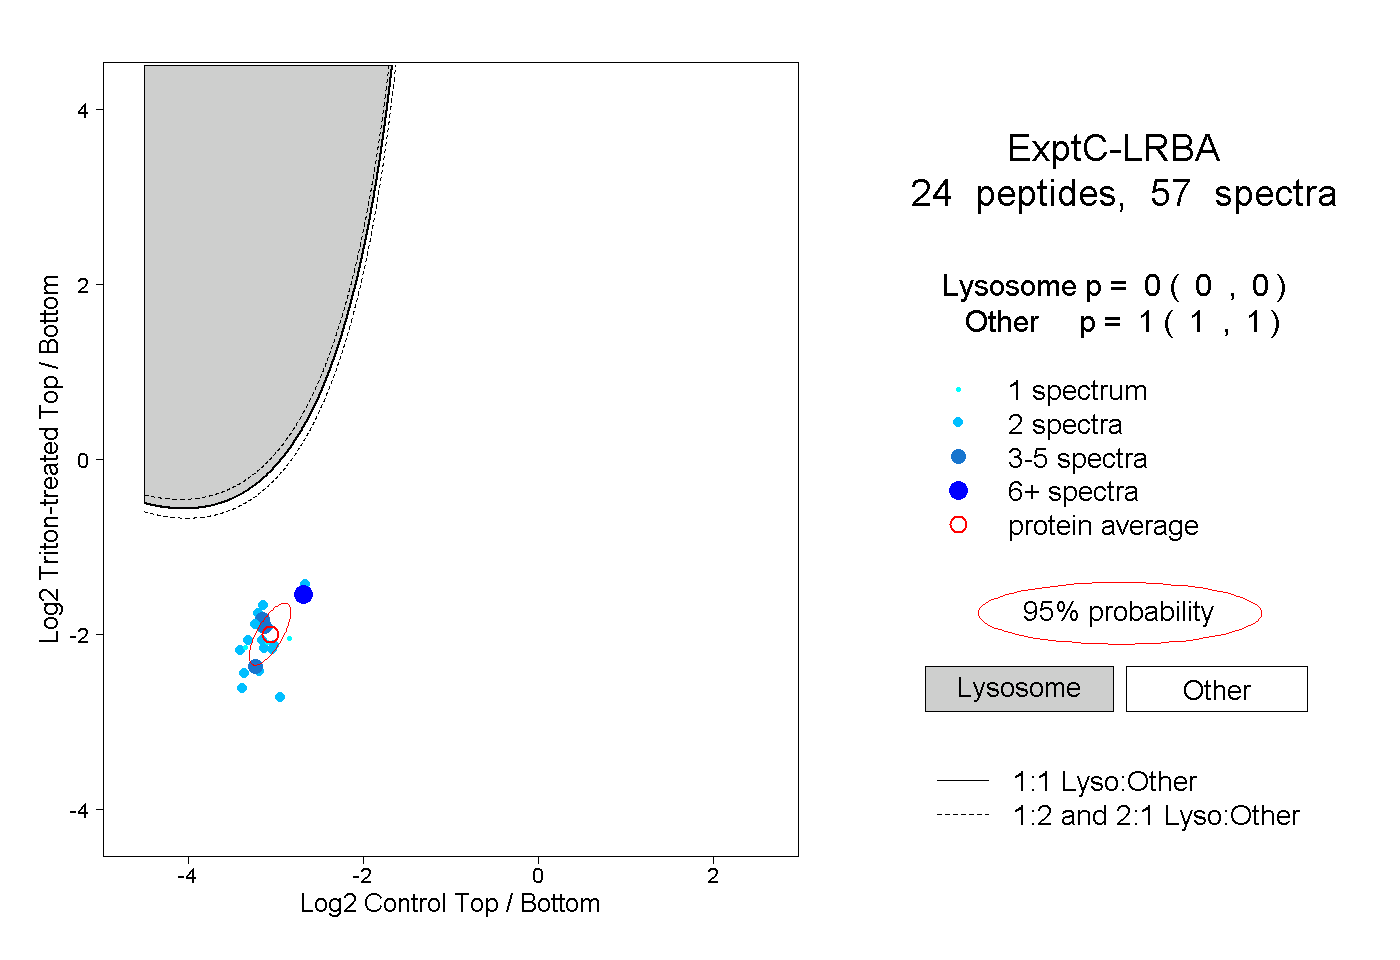
0.000 | 0.000
1.000 | 1.000
2peptides
spectra
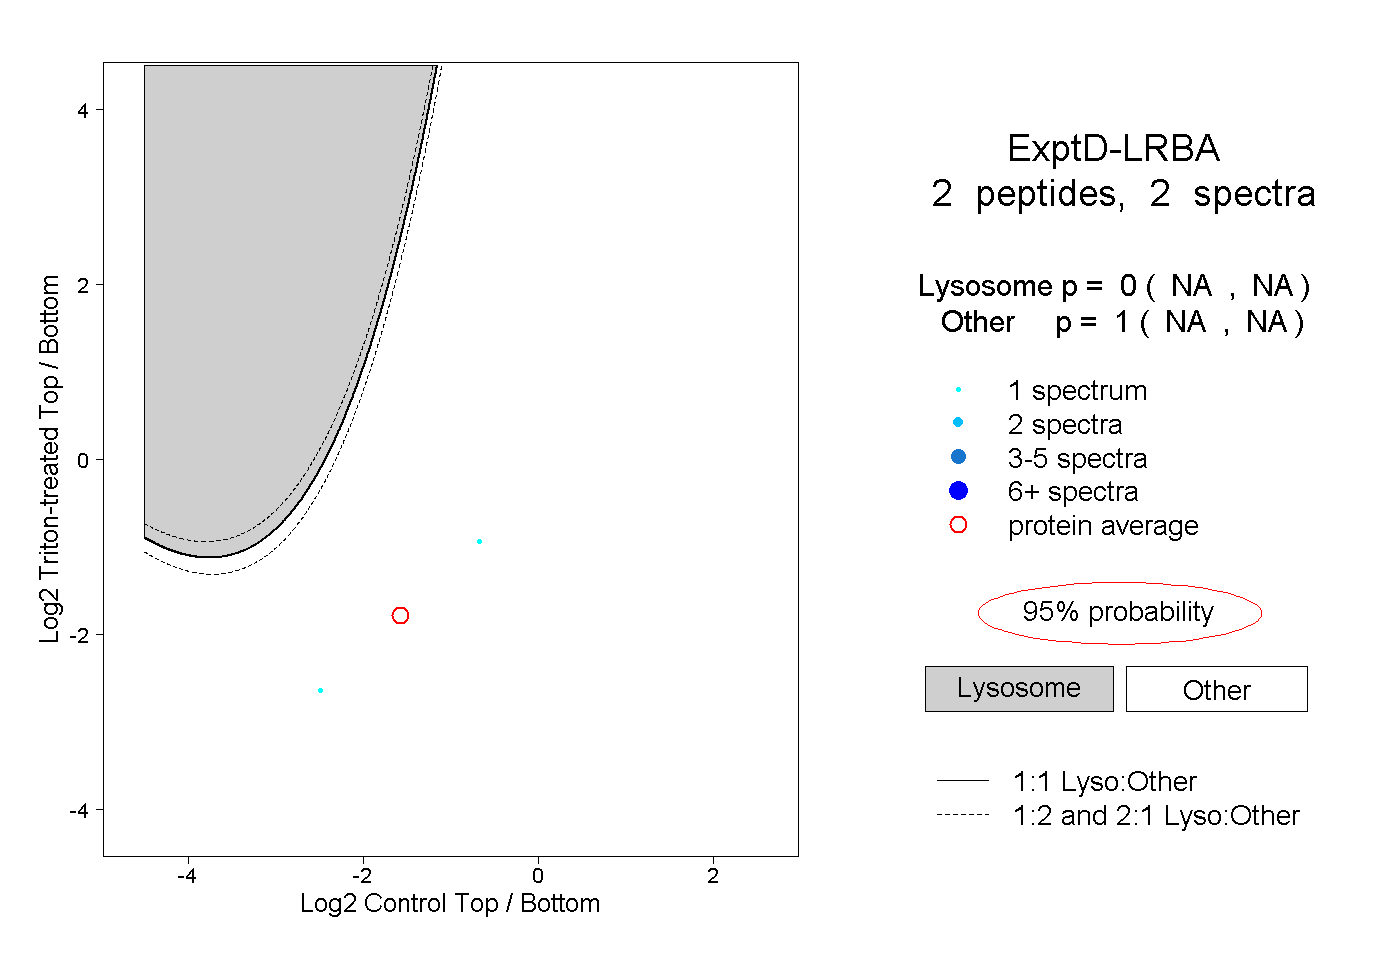
NA | NA
NA | NA