 5
5peptides
spectra
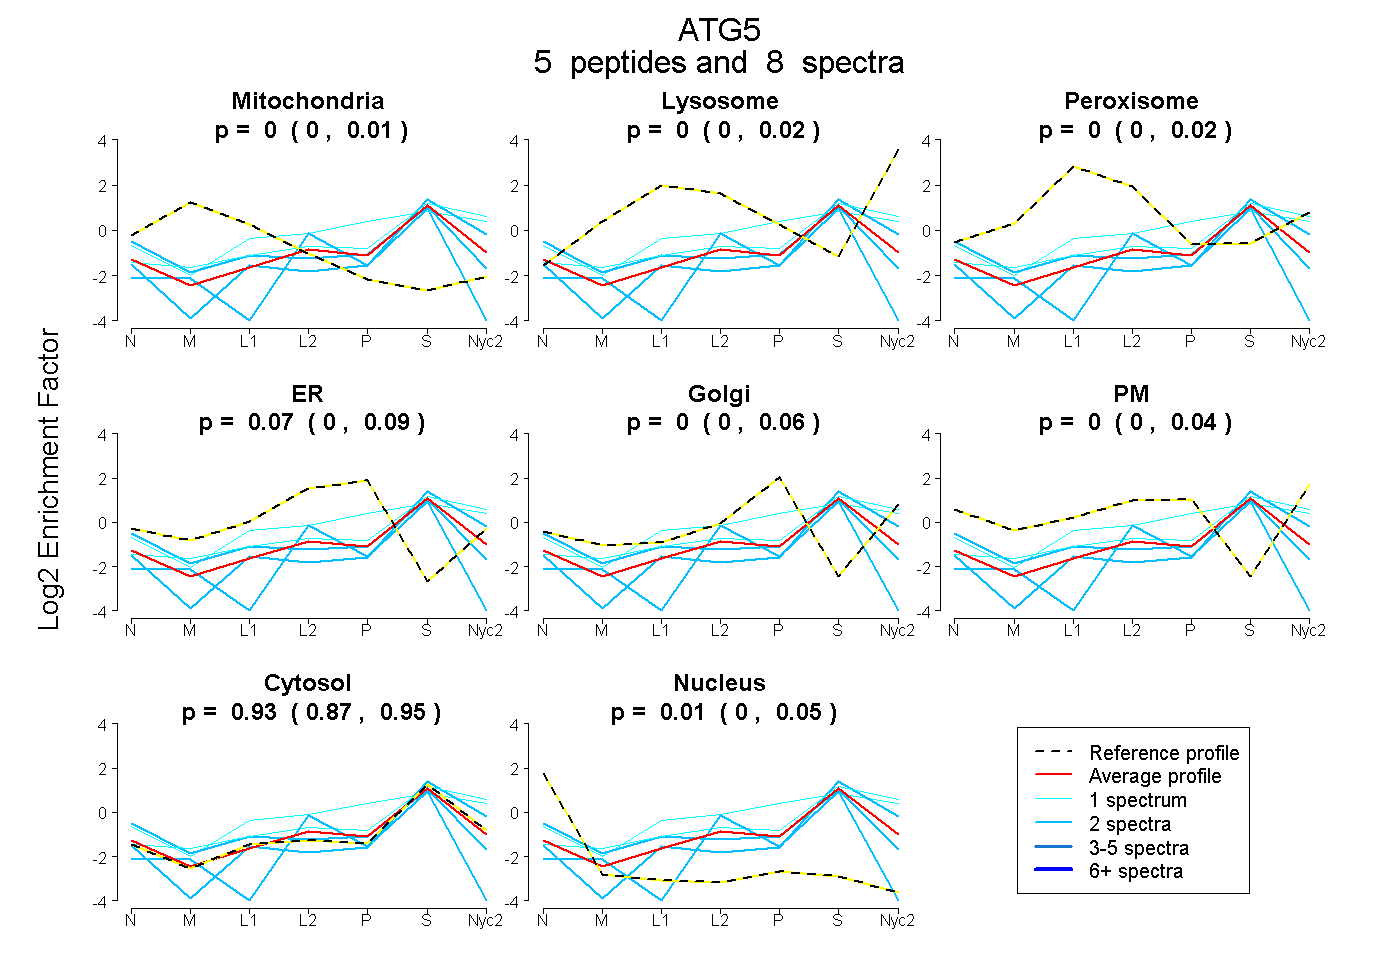
0.000 | 0.013
0.000 | 0.024
0.000 | 0.024
0.000 | 0.094
0.000 | 0.060
0.000 | 0.043
0.871 | 0.948
0.000 | 0.051
1peptide
spectra
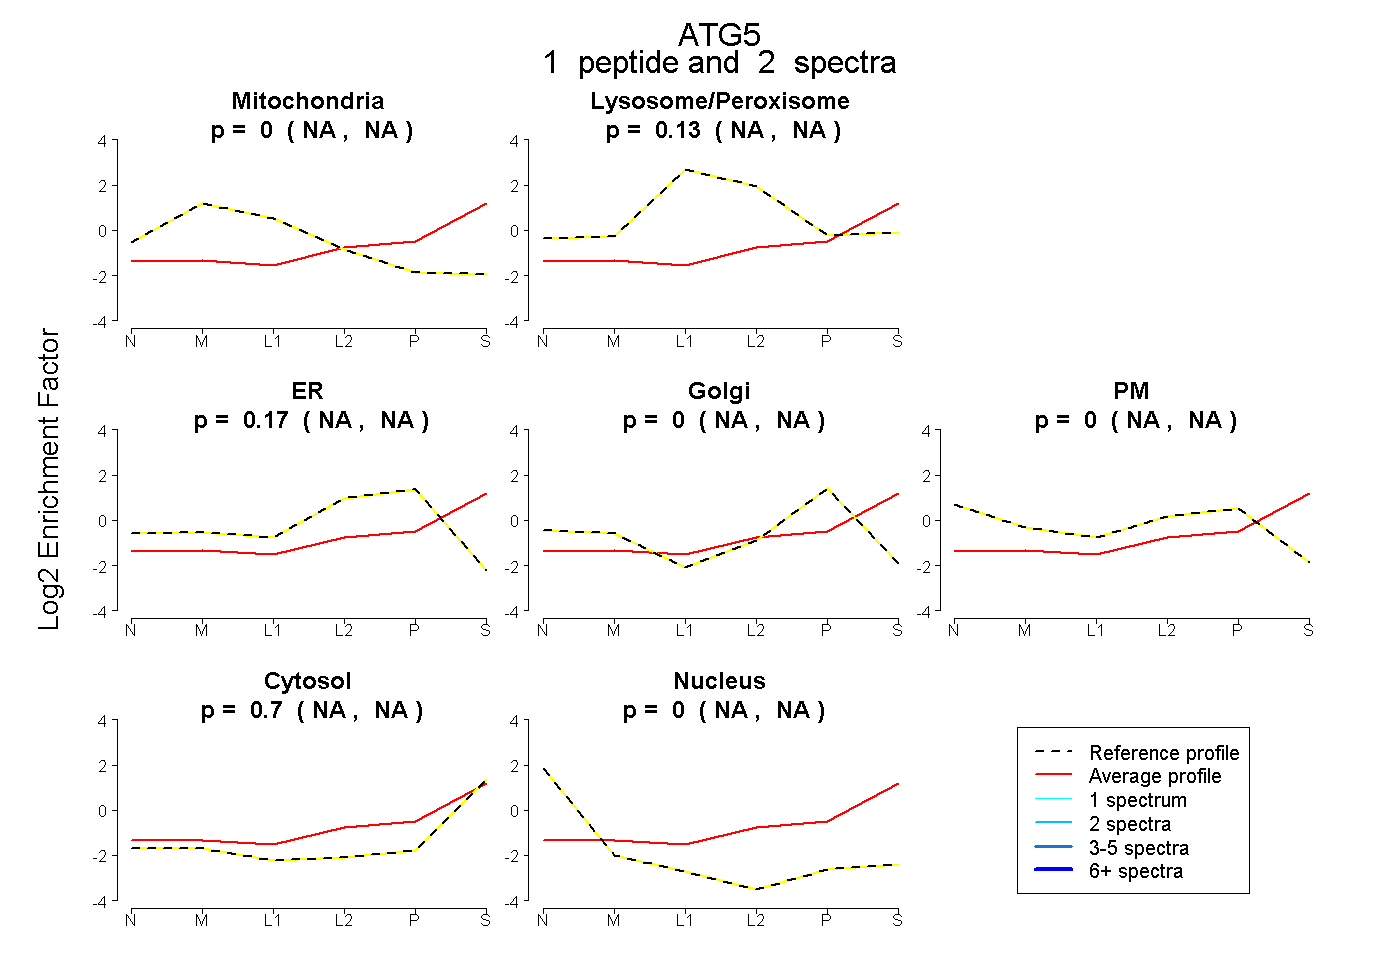
NA | NA
NA | NA
NA | NA
NA | NA
NA | NA
NA | NA
NA | NA
2peptides
spectra
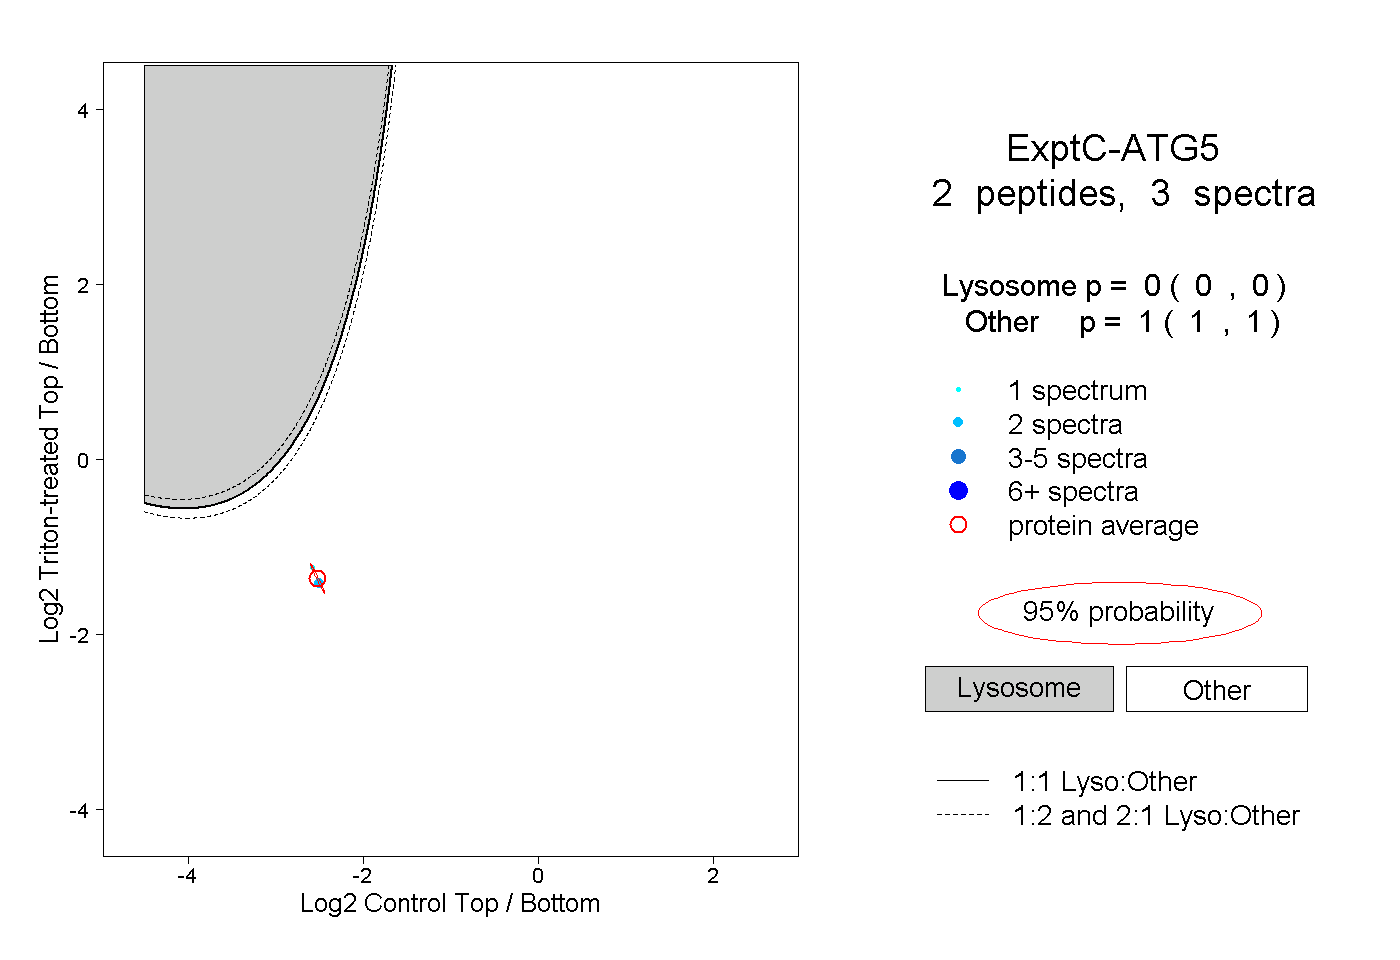
0.000 | 0.000
1.000 | 1.000