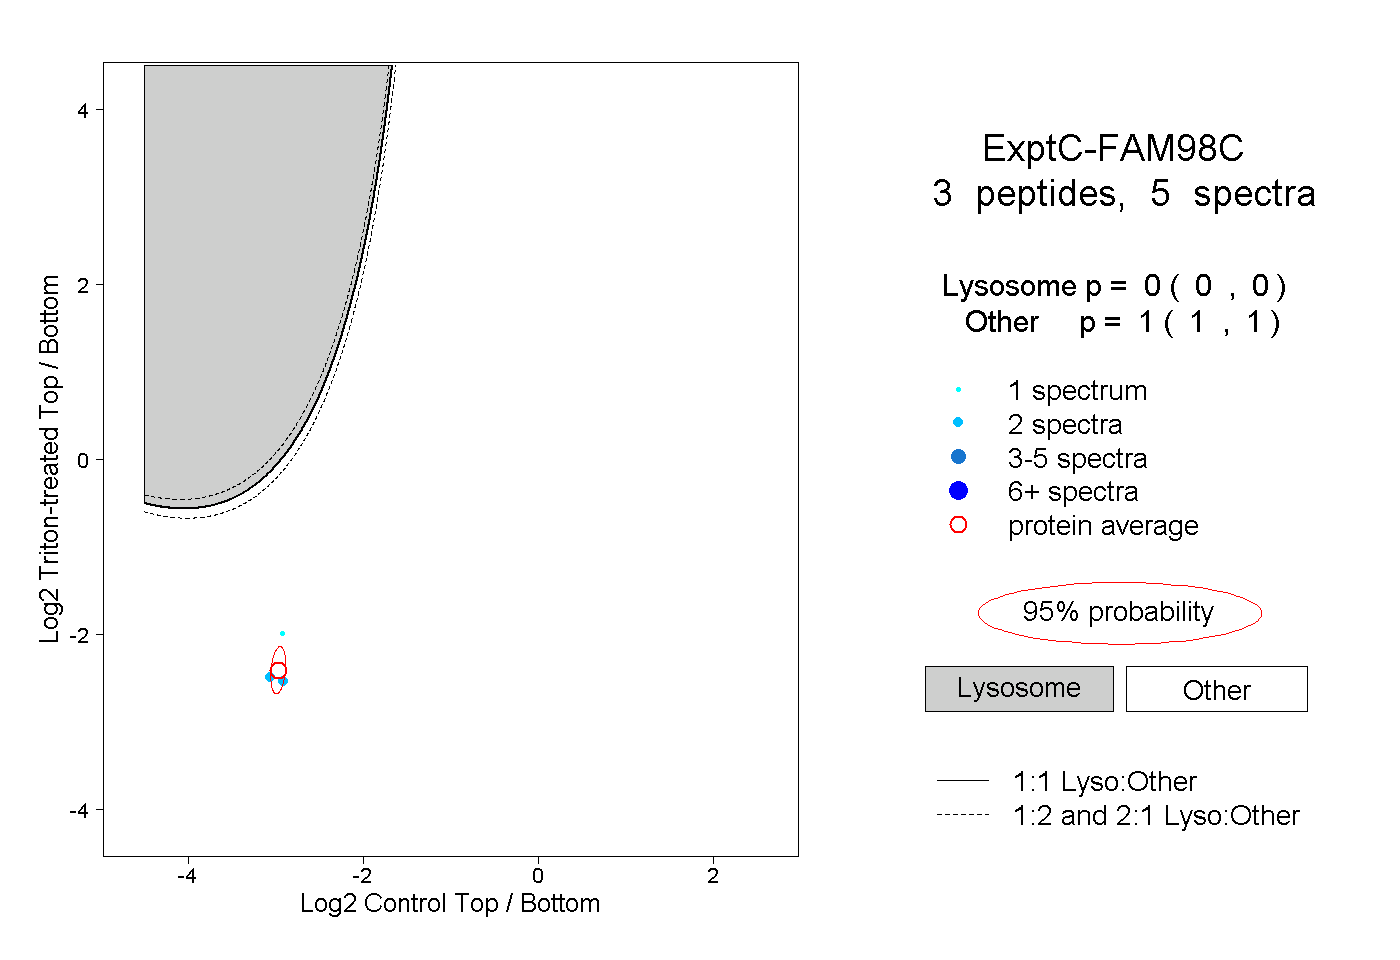
6
6peptides
spectra

0.000 | 0.000
0.000 | 0.000
0.000 | 0.000
0.539 | 0.553
0.000 | 0.000
0.000 | 0.000
0.446 | 0.460
0.000 | 0.000
4peptides
spectra
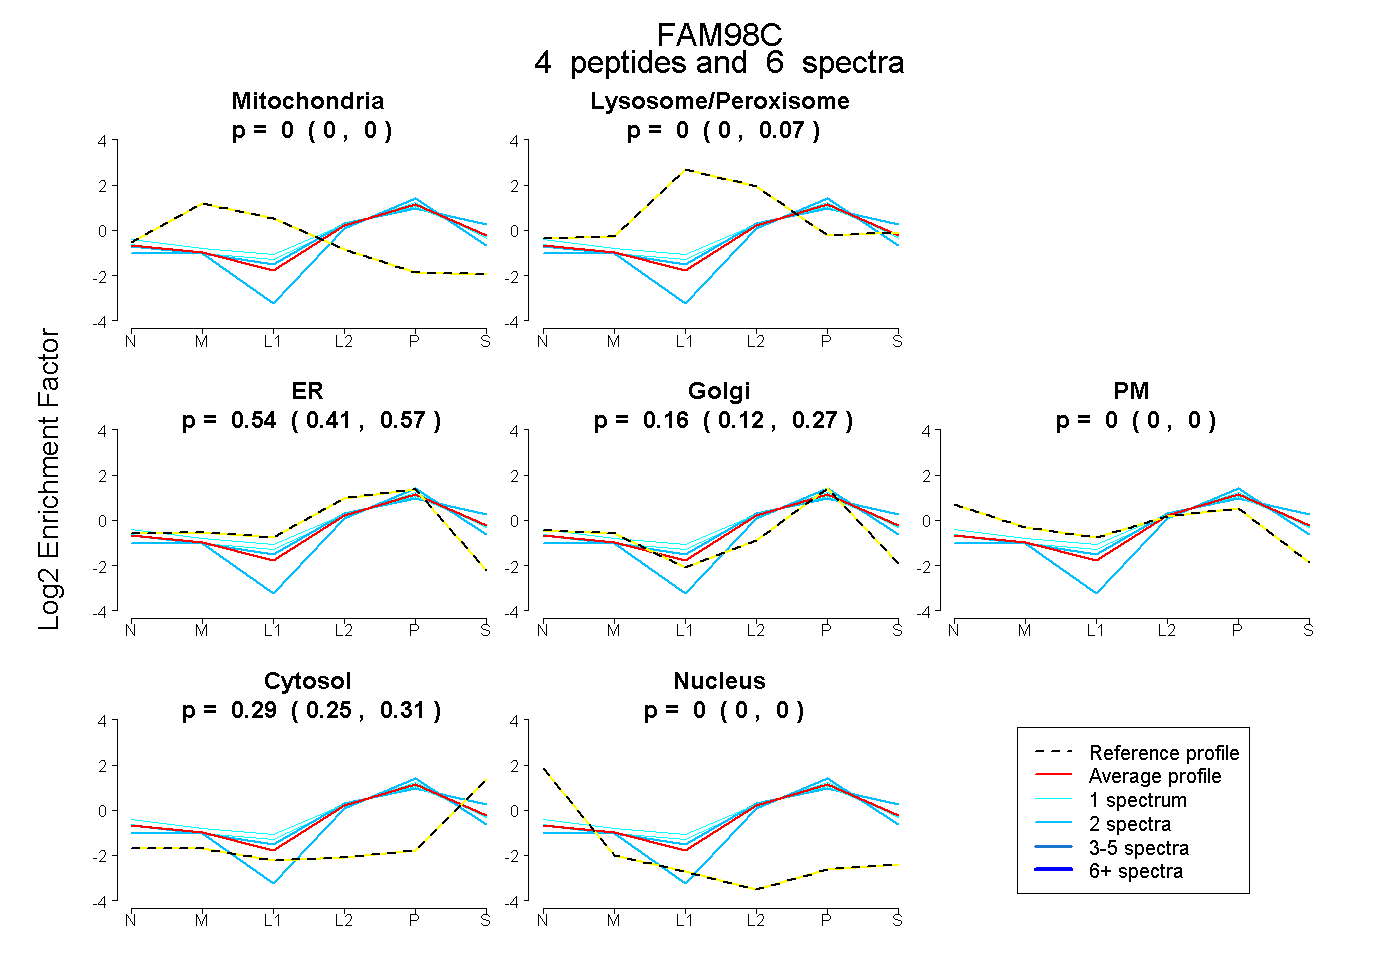
0.000 | 0.000
0.000 | 0.066
0.414 | 0.572
0.117 | 0.266
0.000 | 0.000
0.251 | 0.311
0.000 | 0.000