 6
6peptides
spectra

0.000 | 0.000
0.000 | 0.000
0.000 | 0.000
0.539 | 0.553
0.000 | 0.000
0.000 | 0.000
0.446 | 0.460
0.000 | 0.000
| Plot | Mito | Lyso | Perox | ER | Golgi | PM | Cytosol | Nucleus | |||||
| Expt A |
6 peptides |
12 spectra |
|
0.000 0.000 | 0.000 |
0.000 0.000 | 0.000 |
0.000 0.000 | 0.000 |
0.546 0.539 | 0.553 |
0.000 0.000 | 0.000 |
0.000 0.000 | 0.000 |
0.454 0.446 | 0.460 |
0.000 0.000 | 0.000 |
| 1 spectrum, FLCSELQAAR | 0.000 | 0.000 | 0.000 | 0.607 | 0.000 | 0.000 | 0.393 | 0.000 | ||
| 3 spectra, ALGLPRPLR | 0.000 | 0.000 | 0.000 | 0.590 | 0.000 | 0.000 | 0.400 | 0.010 | ||
| 2 spectra, GTLASQLLR | 0.000 | 0.000 | 0.000 | 0.498 | 0.028 | 0.000 | 0.474 | 0.000 | ||
| 1 spectrum, AEAHSEVMK | 0.000 | 0.000 | 0.000 | 0.558 | 0.000 | 0.000 | 0.442 | 0.000 | ||
| 4 spectra, LVPATSVAAR | 0.000 | 0.000 | 0.000 | 0.395 | 0.102 | 0.000 | 0.498 | 0.005 | ||
| 1 spectrum, EEGTAVLGAGHGPDAEEEFLR | 0.000 | 0.000 | 0.000 | 0.520 | 0.000 | 0.000 | 0.480 | 0.000 |
| Plot | Mito | Lyso or Perox | ER | Golgi | PM | Cytosol | Nucleus | ||||||
| Expt B |
4 peptides |
6 spectra |
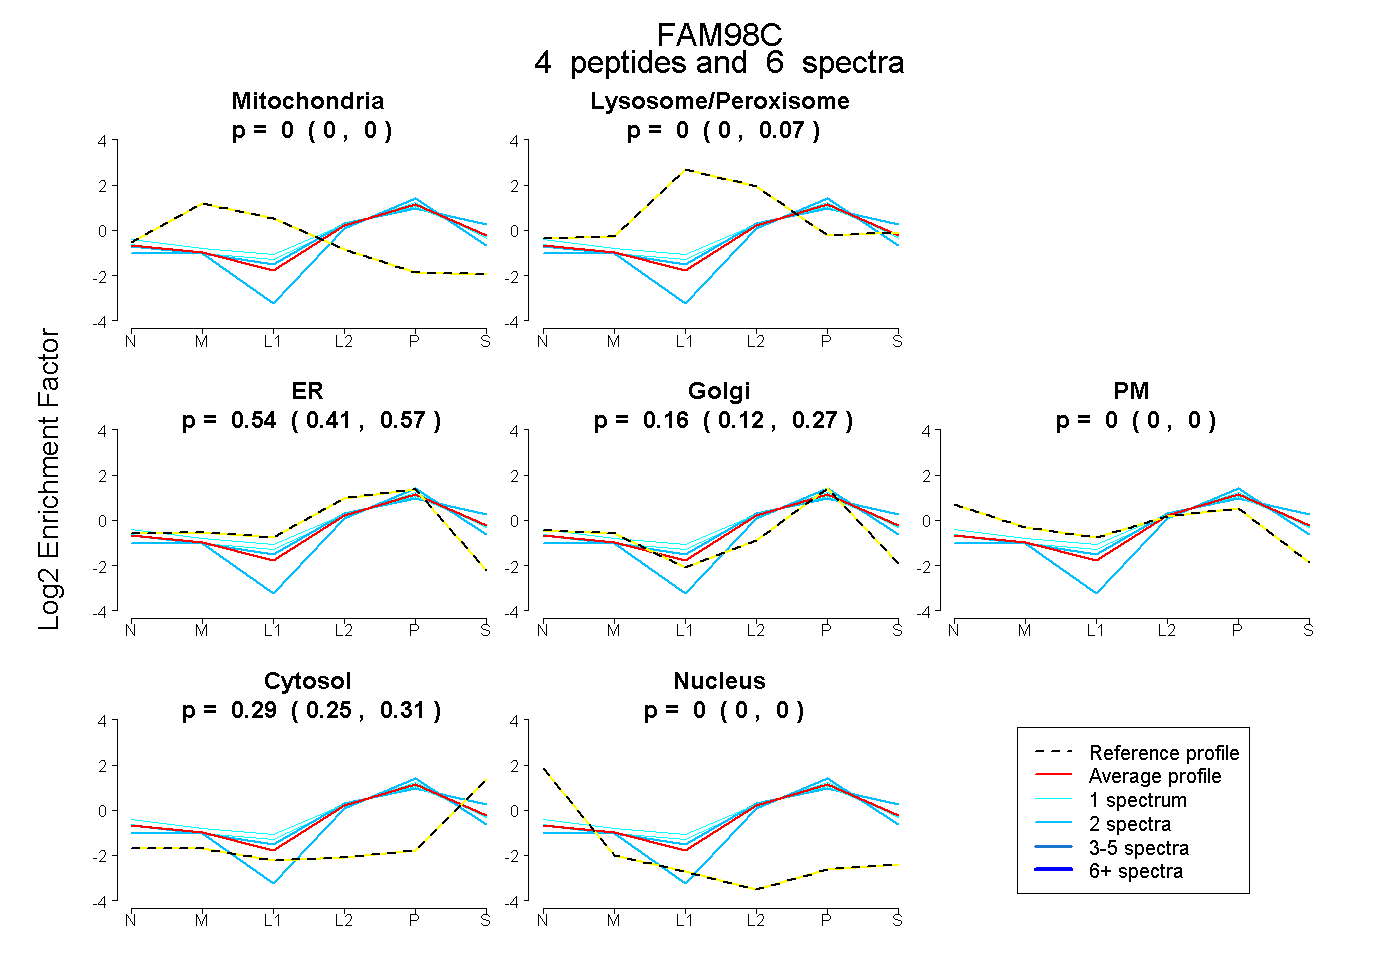 |
0.000 0.000 | 0.000 |
0.000 0.000 | 0.066 |
0.542 0.414 | 0.572 |
0.165 0.117 | 0.266 |
0.000 0.000 | 0.000 |
0.293 0.251 | 0.311 |
0.000 0.000 | 0.000 |
|||
| Plot | Lyso | Other | |||||||||||
| Expt C |
3 peptides |
5 spectra |
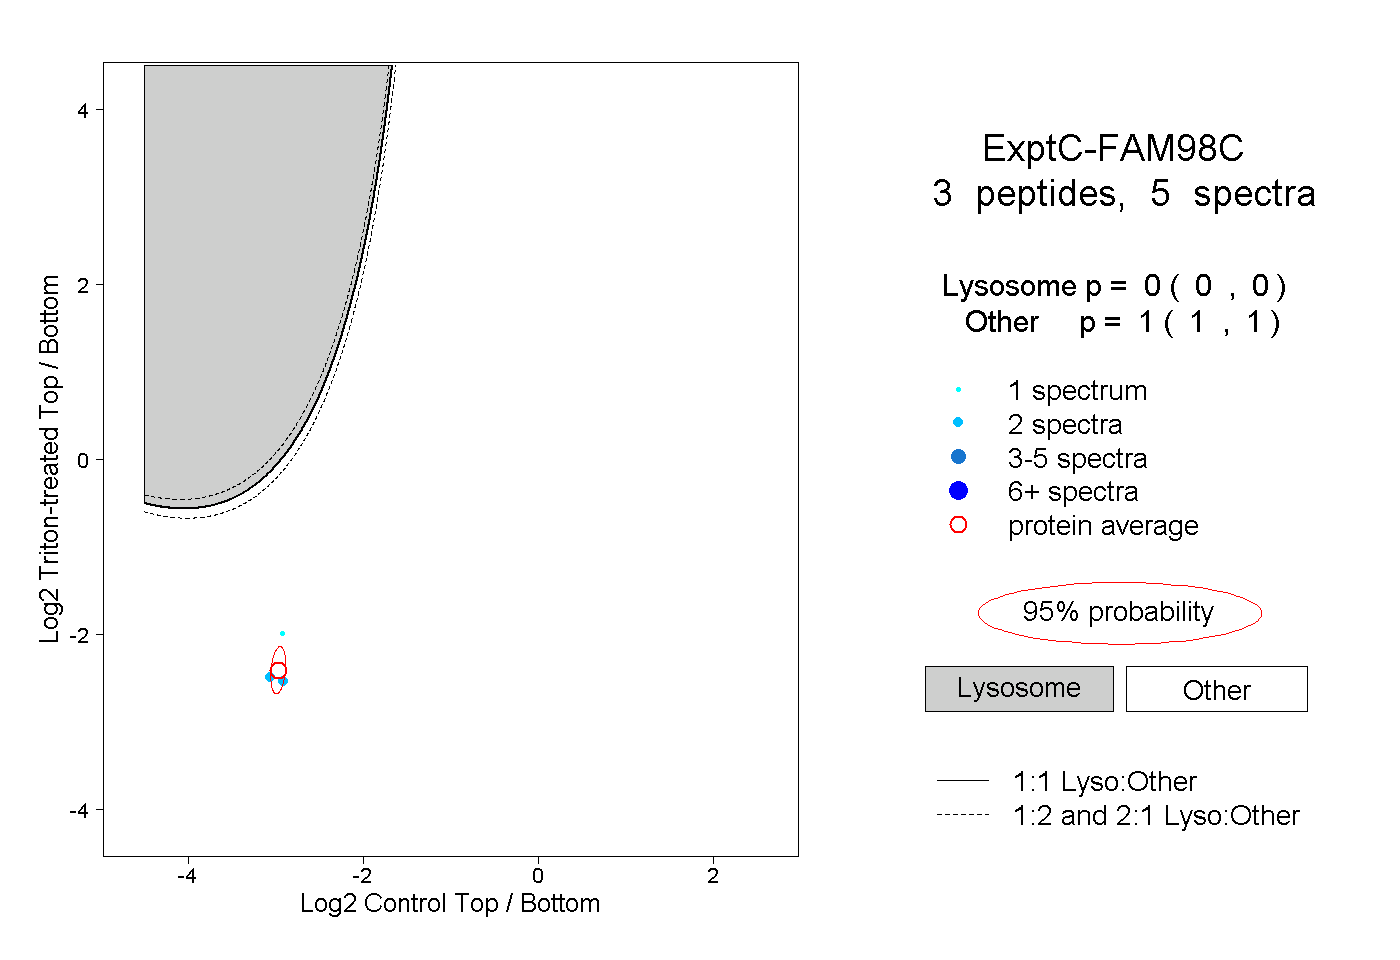 |
0.000 0.000 | 0.000 |
1.000 1.000 | 1.000 |