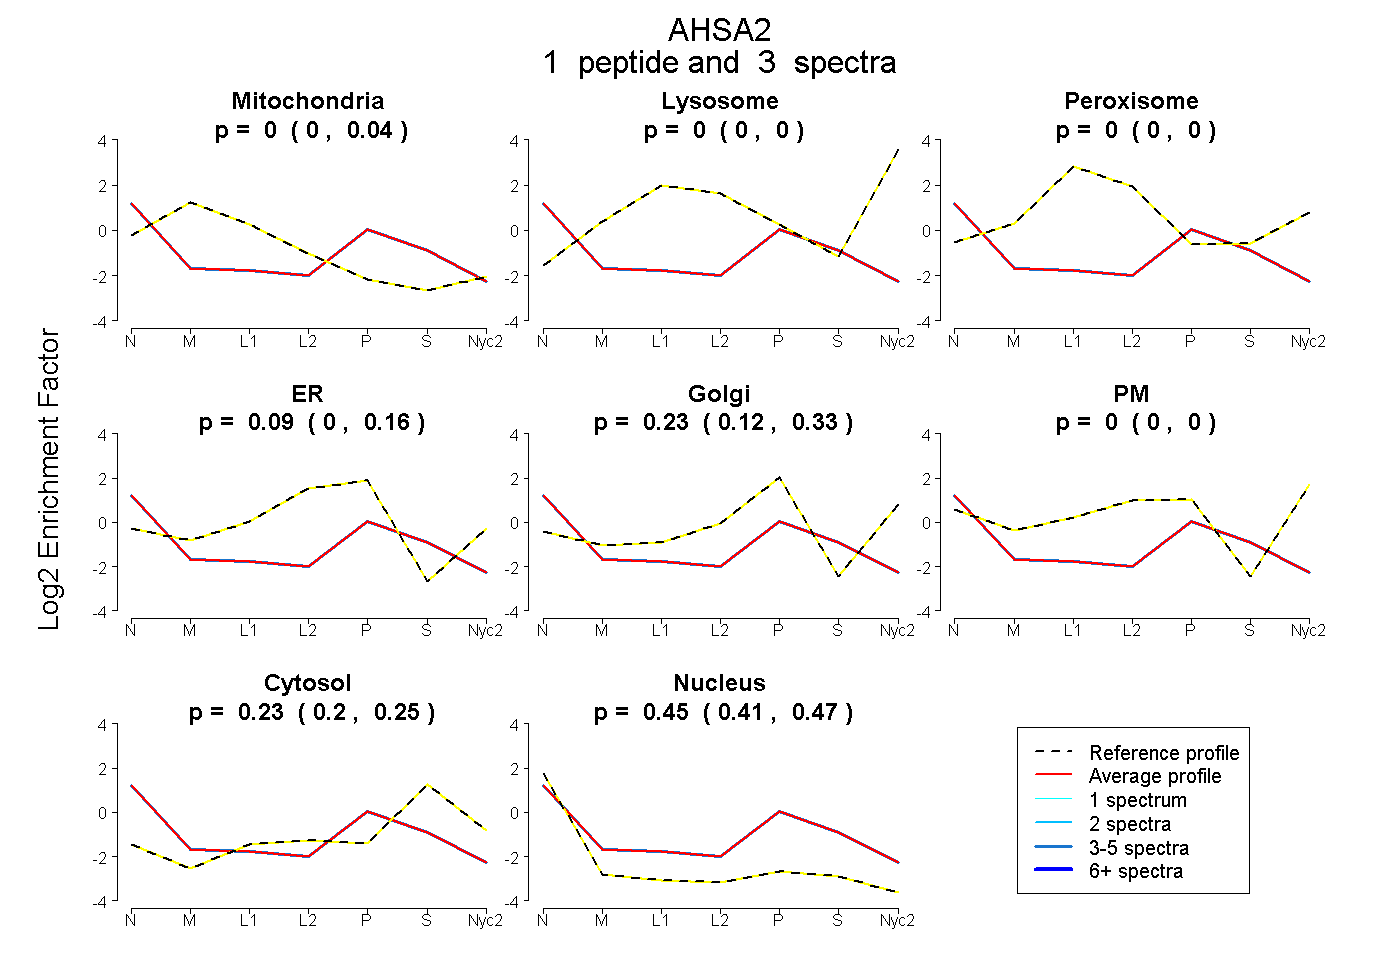
 1
1peptide
spectra
0.000 | 0.036
0.000 | 0.000
0.000 | 0.000
0.000 | 0.163
0.120 | 0.330
0.000 | 0.000
0.203 | 0.251
0.411 | 0.471
| Plot | Mito | Lyso | Perox | ER | Golgi | PM | Cytosol | Nucleus | |||||
| Expt A |
1 peptide |
3 spectra |
|
0.000 0.000 | 0.036 |
0.000 0.000 | 0.000 |
0.000 0.000 | 0.000 |
0.091 0.000 | 0.163 |
0.230 0.120 | 0.330 |
0.000 0.000 | 0.000 |
0.231 0.203 | 0.251 |
0.448 0.411 | 0.471 |
| 3 spectra, ILPTK | 0.000 | 0.000 | 0.000 | 0.091 | 0.230 | 0.000 | 0.231 | 0.448 |