 3
3peptides
spectra
0.000 | 0.000
0.000 | 0.194
0.000 | 0.164
0.000 | 0.000
0.000 | 0.231
0.000 | 0.203
0.578 | 0.650
0.000 | 0.000
2peptides
spectra
0.000 | 0.068
0.930 | 1.000
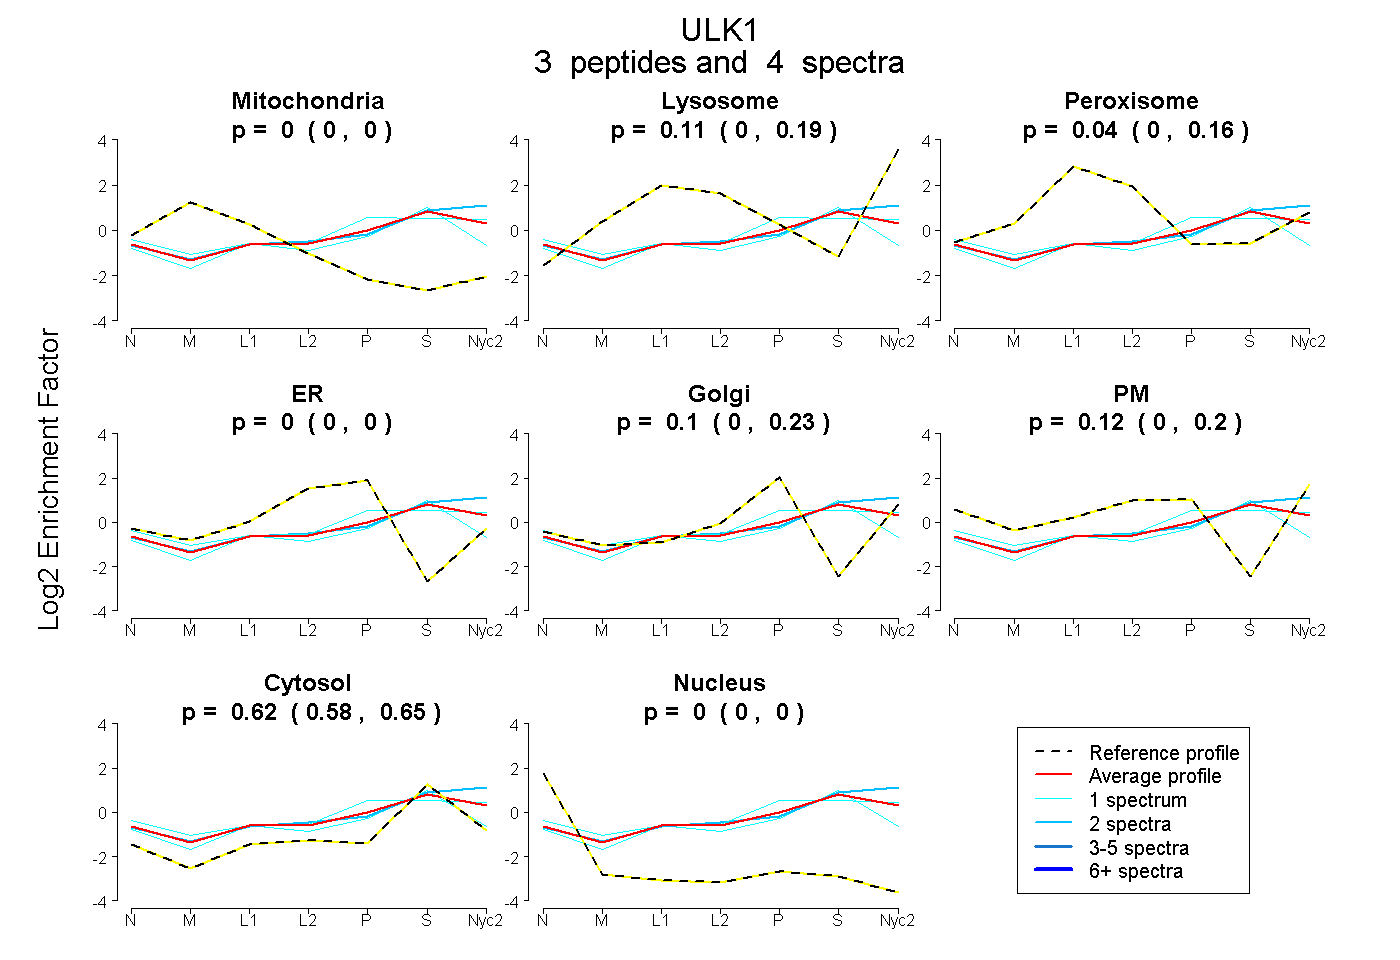
| Plot | Mito | Lyso | Perox | ER | Golgi | PM | Cytosol | Nucleus | |||||
| Expt A |
3 peptides |
4 spectra |
|
0.000 0.000 | 0.000 |
0.113 0.000 | 0.194 |
0.041 0.000 | 0.164 |
0.000 0.000 | 0.000 |
0.103 0.000 | 0.231 |
0.121 0.000 | 0.203 |
0.622 0.578 | 0.650 |
0.000 0.000 | 0.000 |
||
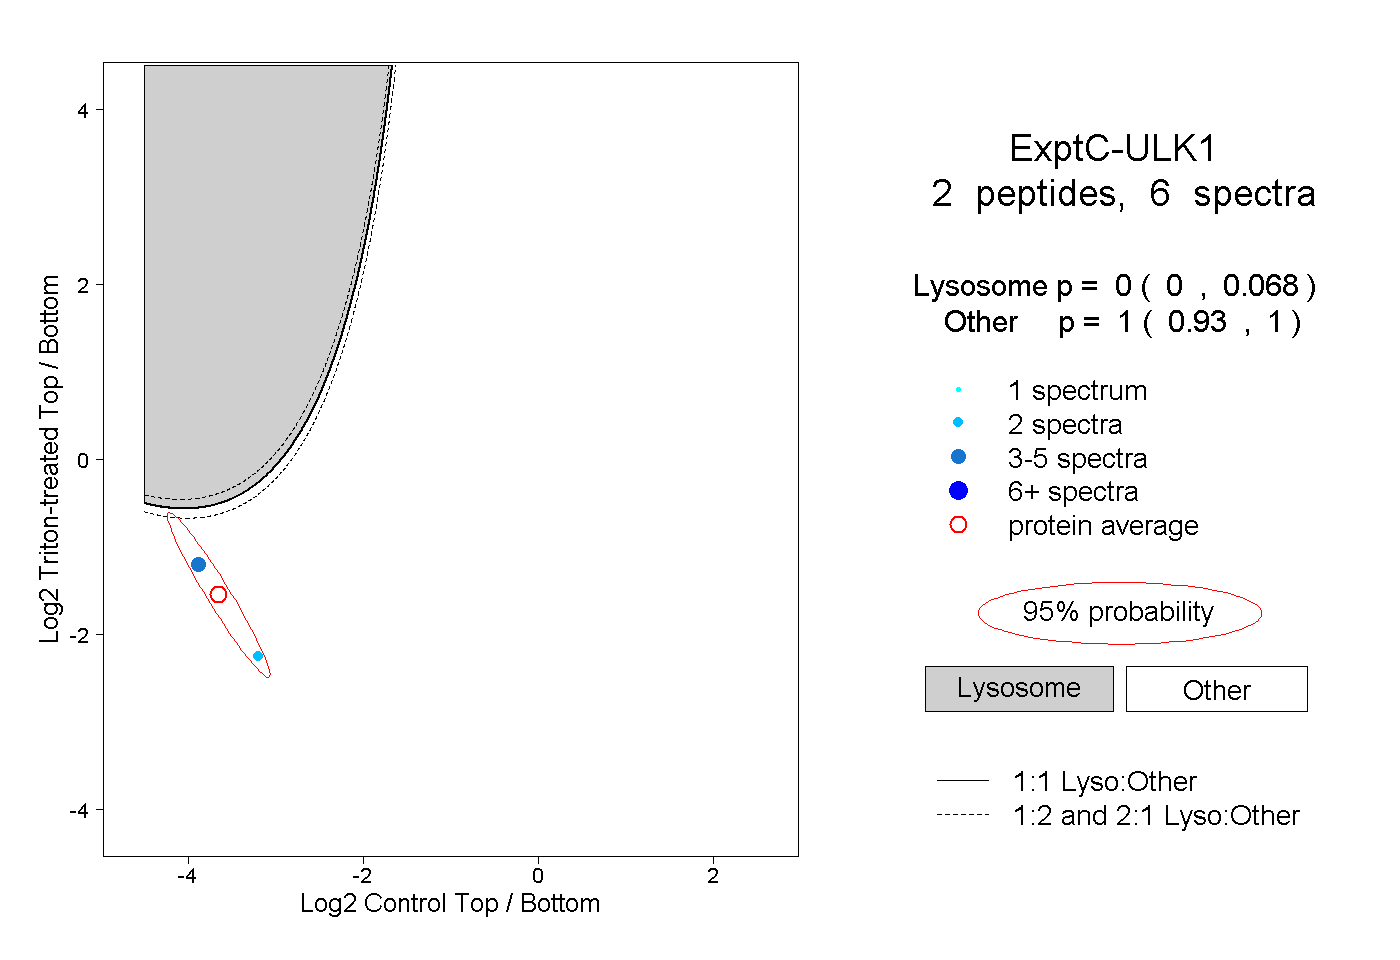
| Plot | Lyso | Other | |||||||||||
| Expt C |
2 peptides |
6 spectra |
|
0.000 0.000 | 0.068 |
1.000 0.930 | 1.000 |