 10
10peptides
spectra
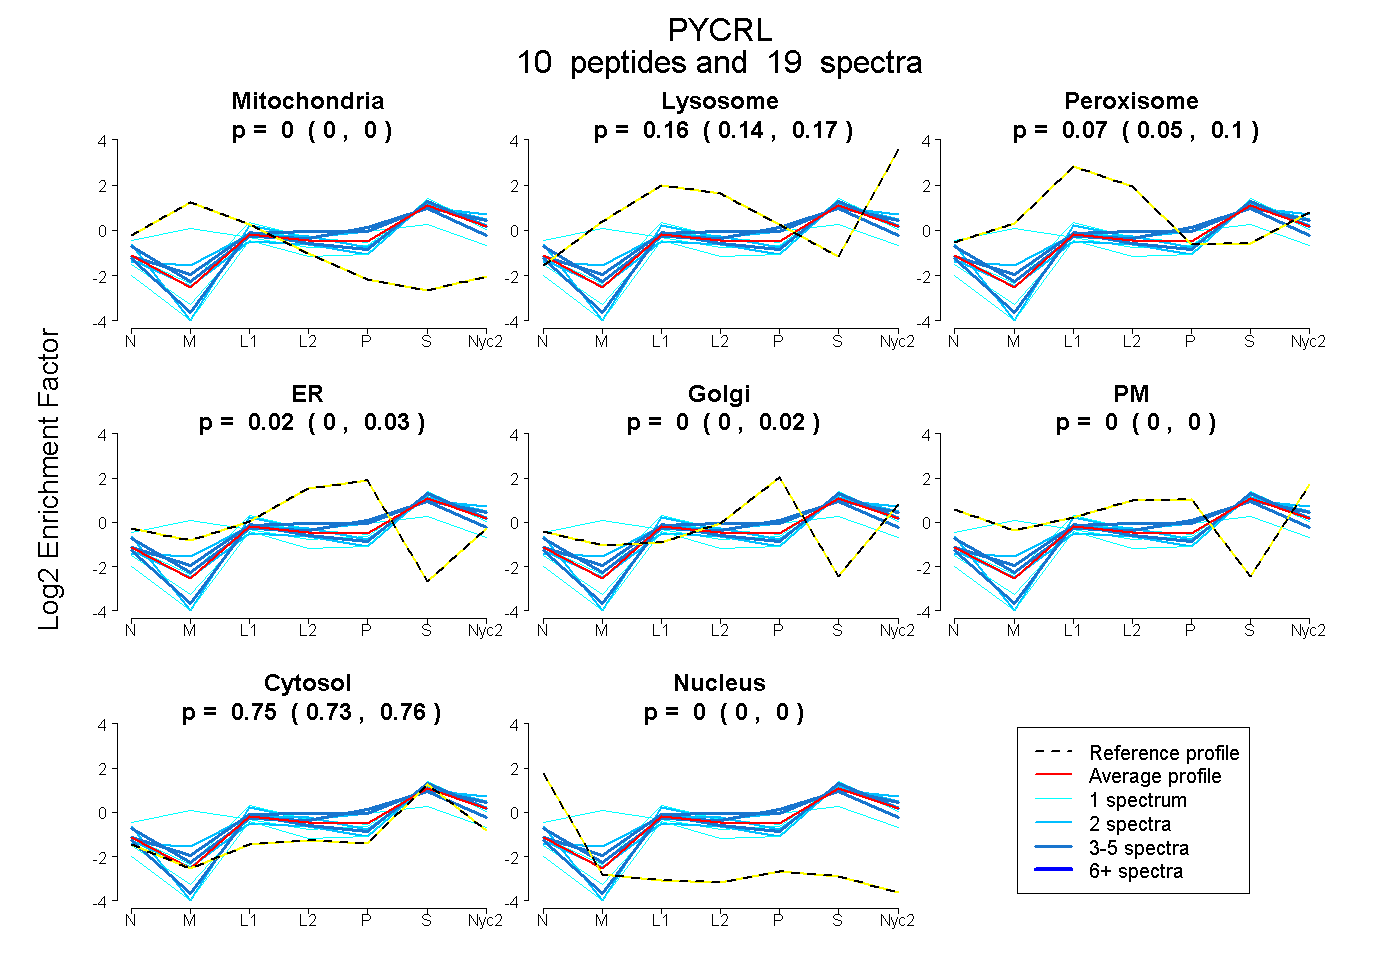
0.000 | 0.000
0.138 | 0.172
0.051 | 0.098
0.000 | 0.031
0.000 | 0.023
0.000 | 0.000
0.731 | 0.759
0.000 | 0.000
3peptides
spectra
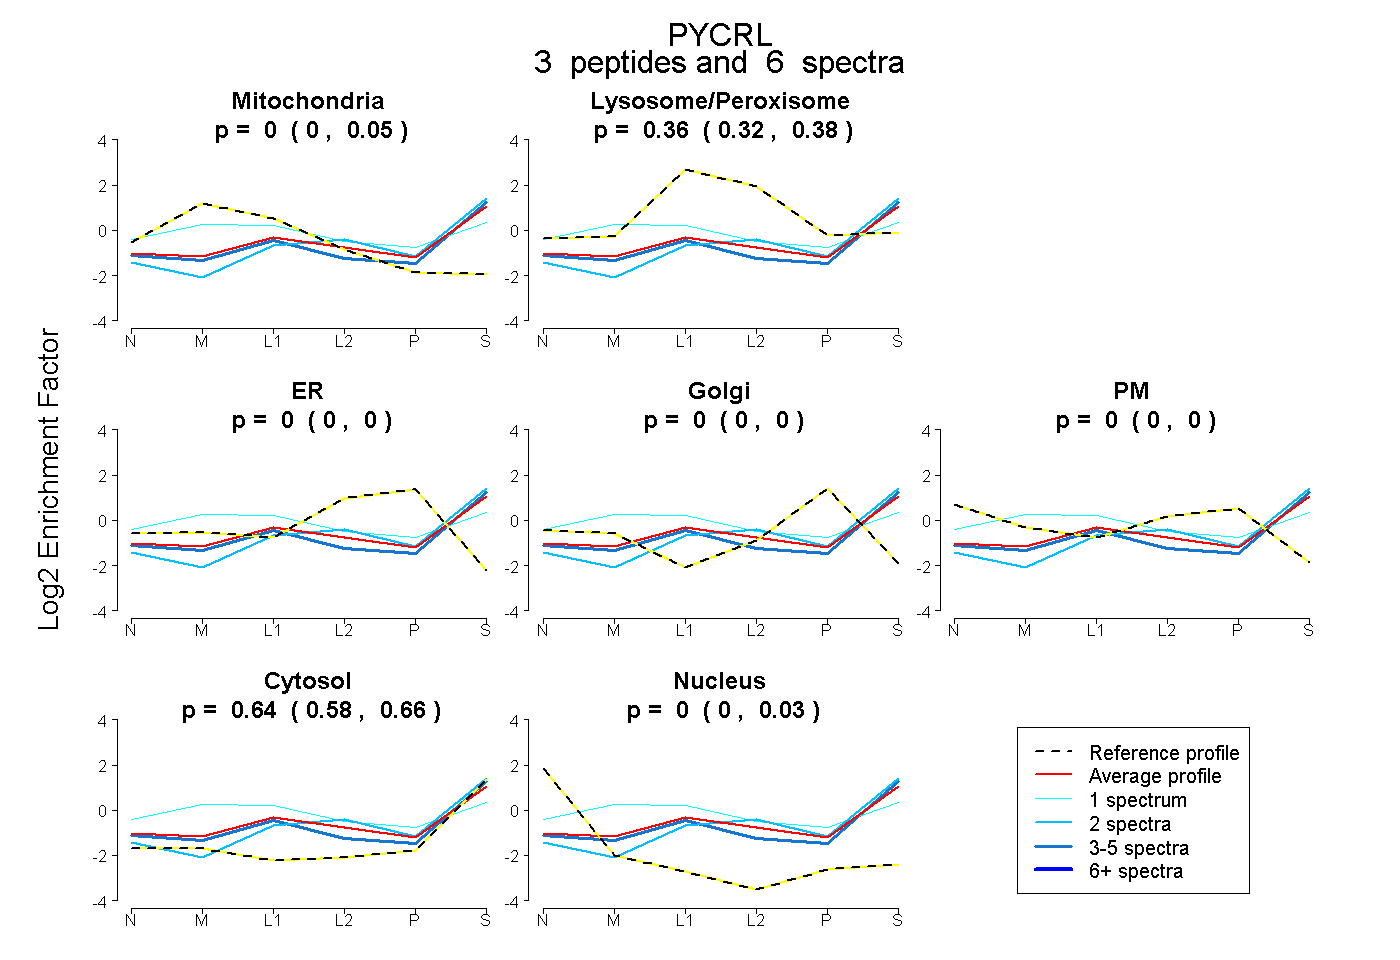
0.000 | 0.054
0.315 | 0.383
0.000 | 0.000
0.000 | 0.000
0.000 | 0.000
0.581 | 0.664
0.000 | 0.033
8peptides
spectra
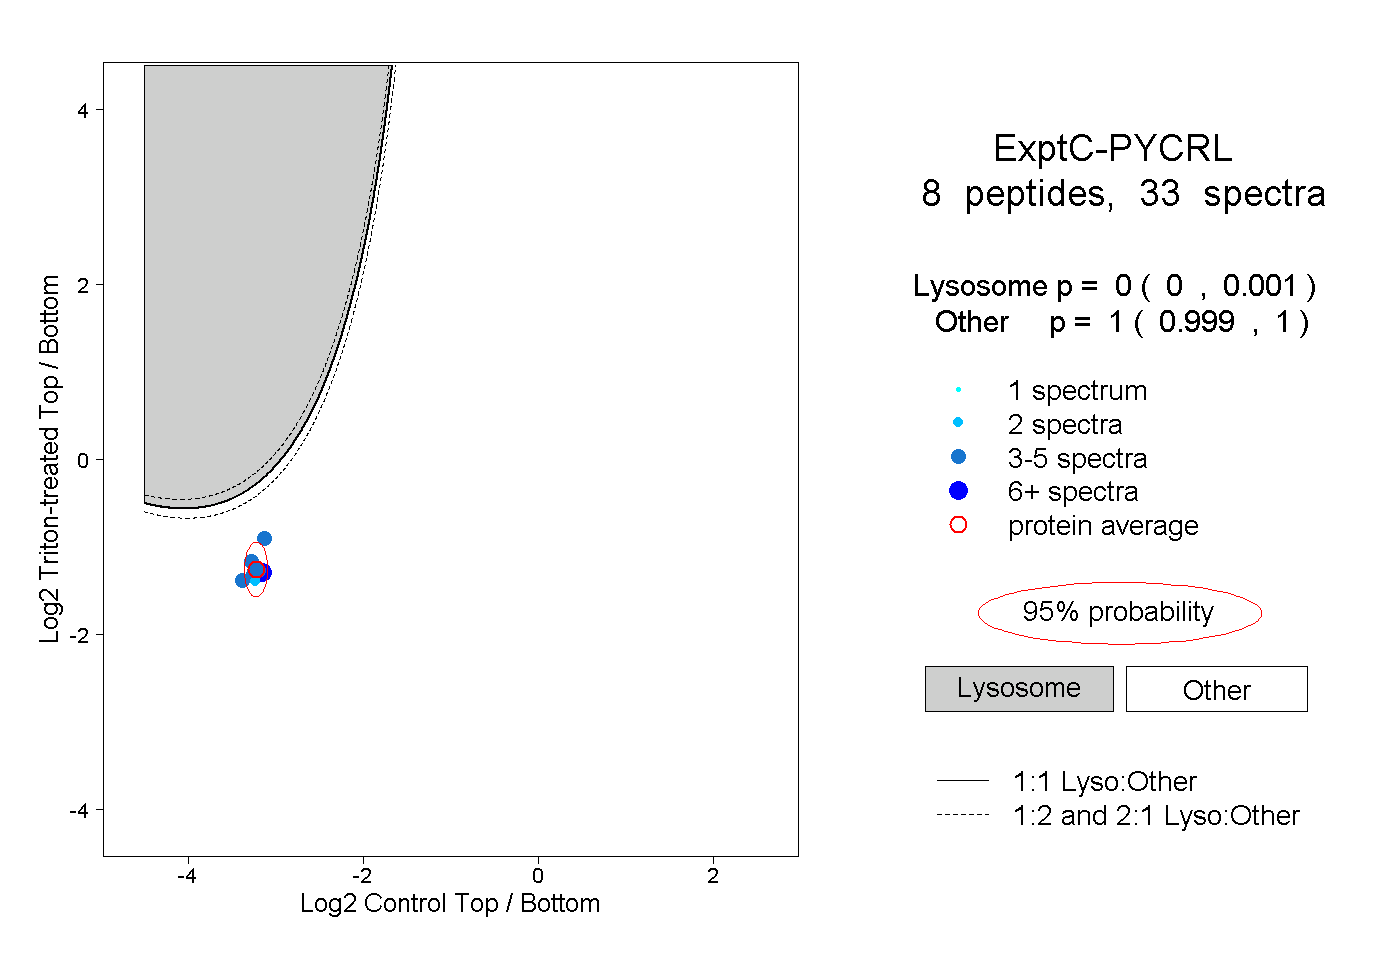
0.000 | 0.001
0.999 | 1.000
3peptides
spectra
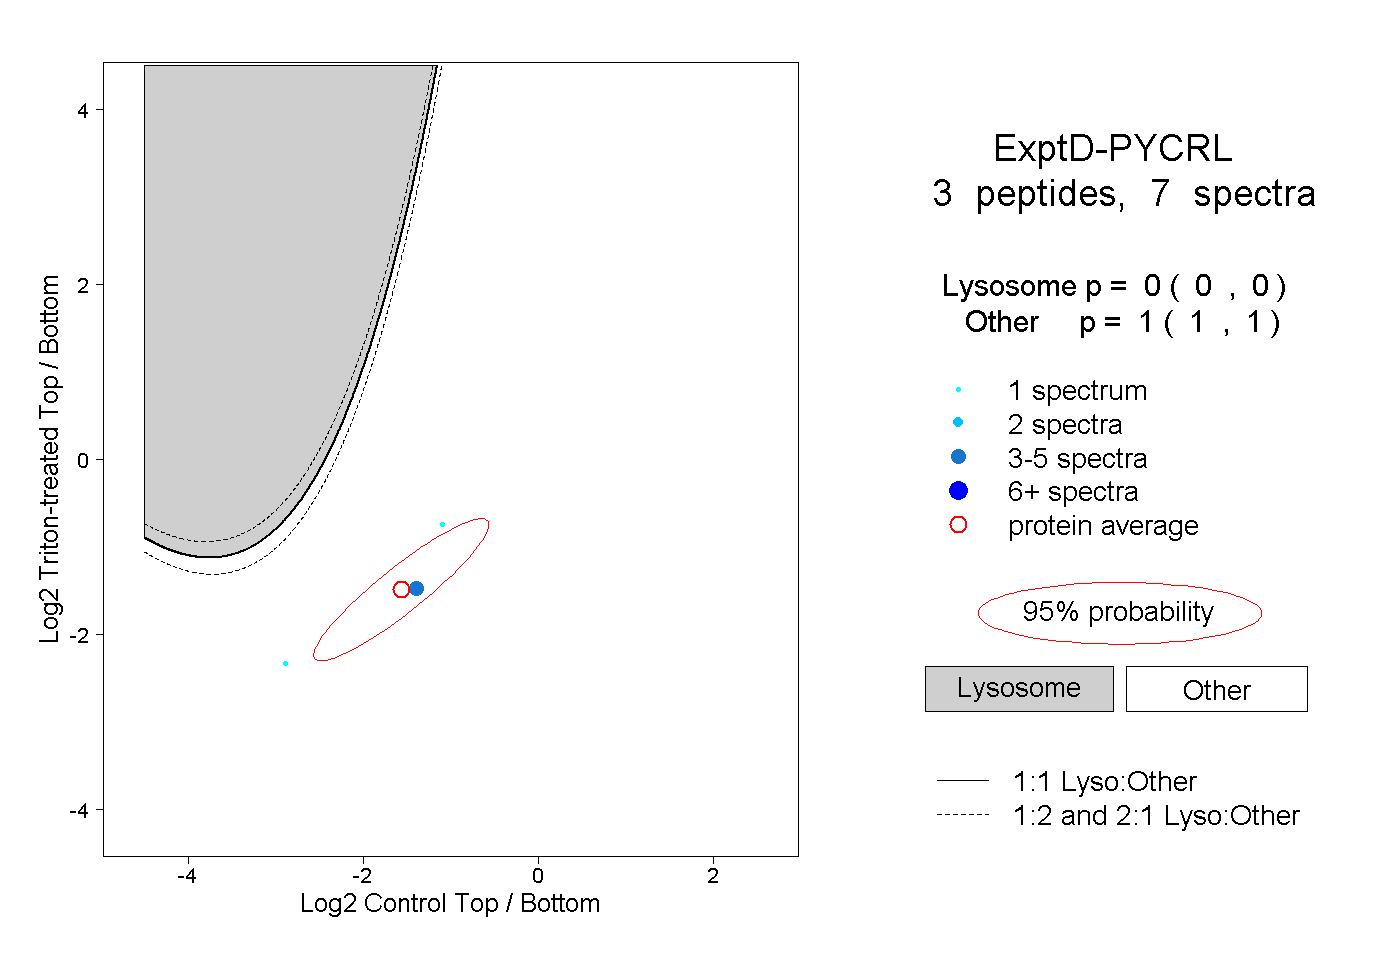
0.000 | 0.000
1.000 | 1.000