IDH3G
[ENSRNOP00000053220]
Main page
| | | Plot |
Mito |
Lyso |
|
Perox |
ER |
Golgi |
PM |
Cytosol |
Nucleus |
|
| Expt A |
 11
11
peptides |
42
spectra |
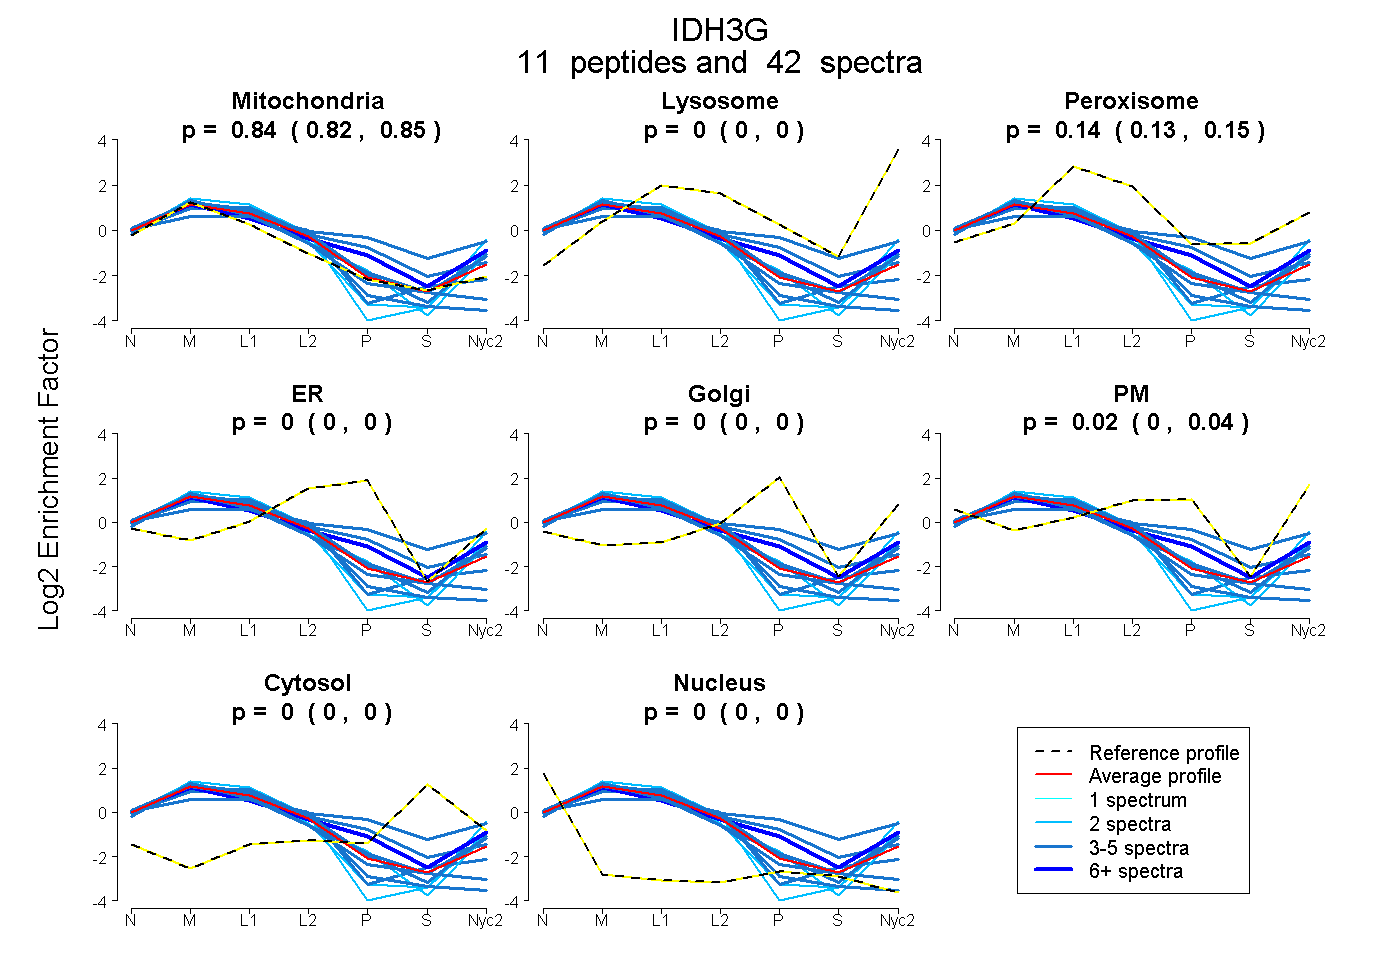 |
0.836
0.821 | 0.849 |
0.000
0.000 | 0.000 |
|
0.140
0.130 | 0.149 |
0.000
0.000 | 0.000 |
0.000
0.000 | 0.000 |
0.023
0.004 | 0.039 |
0.000
0.000 | 0.000 |
0.000
0.000 | 0.000 |
|
| | | Plot |
Mito |
|
Lyso or Perox |
|
ER |
Golgi |
PM |
Cytosol |
Nucleus |
|
| Expt B |
6
peptides |
12
spectra |
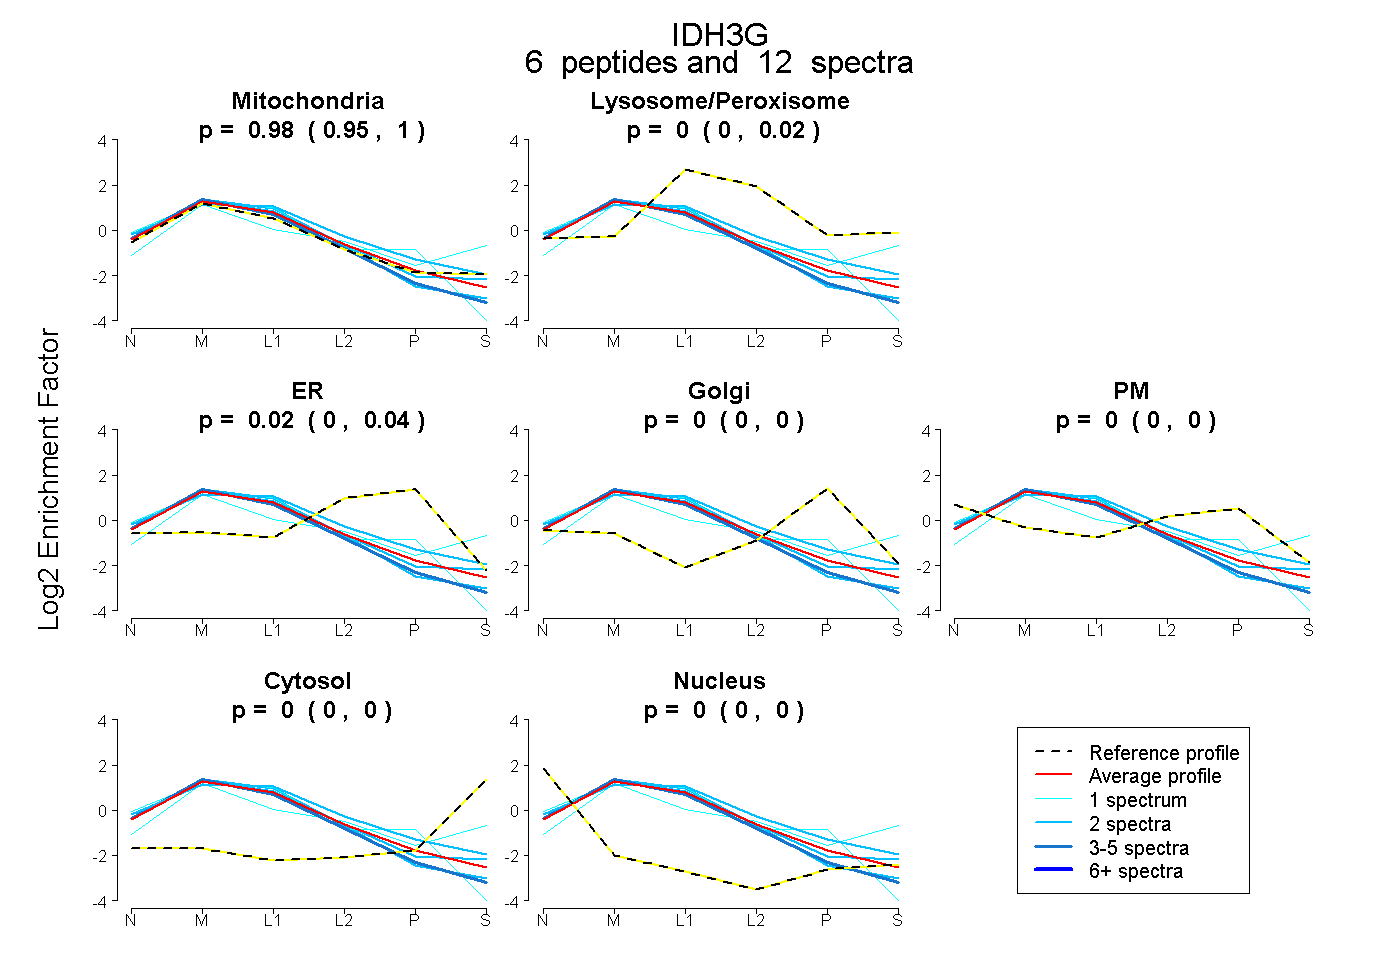 |
0.978
0.949 | 0.998 |
|
0.000
0.000 | 0.021 |
|
0.022
0.000 | 0.044 |
0.000
0.000 | 0.000 |
0.000
0.000 | 0.000 |
0.000
0.000 | 0.000 |
0.000
0.000 | 0.000 |
|
| 2 spectra, IAEYAFK |
0.981 |
|
0.019 |
|
0.000 |
0.000 |
0.000 |
0.000 |
0.000 |
|
| 1 spectrum, LGDGLFLQCCR |
0.831 |
|
0.000 |
|
0.169 |
0.000 |
0.000 |
0.000 |
0.000 |
|
| 2 spectra, VTAVHK |
0.787 |
|
0.162 |
|
0.000 |
0.000 |
0.051 |
0.000 |
0.000 |
|
| 1 spectrum, NAIMAIR |
0.683 |
|
0.120 |
|
0.000 |
0.000 |
0.000 |
0.197 |
0.000 |
|
| 4 spectra, SLPGVVTR |
0.995 |
|
0.000 |
|
0.000 |
0.000 |
0.000 |
0.000 |
0.005 |
|
| 2 spectra, DIDILIVR |
1.000 |
|
0.000 |
|
0.000 |
0.000 |
0.000 |
0.000 |
0.000 |
|
| | | Plot |
|
Lyso |
|
|
|
|
|
|
|
Other |
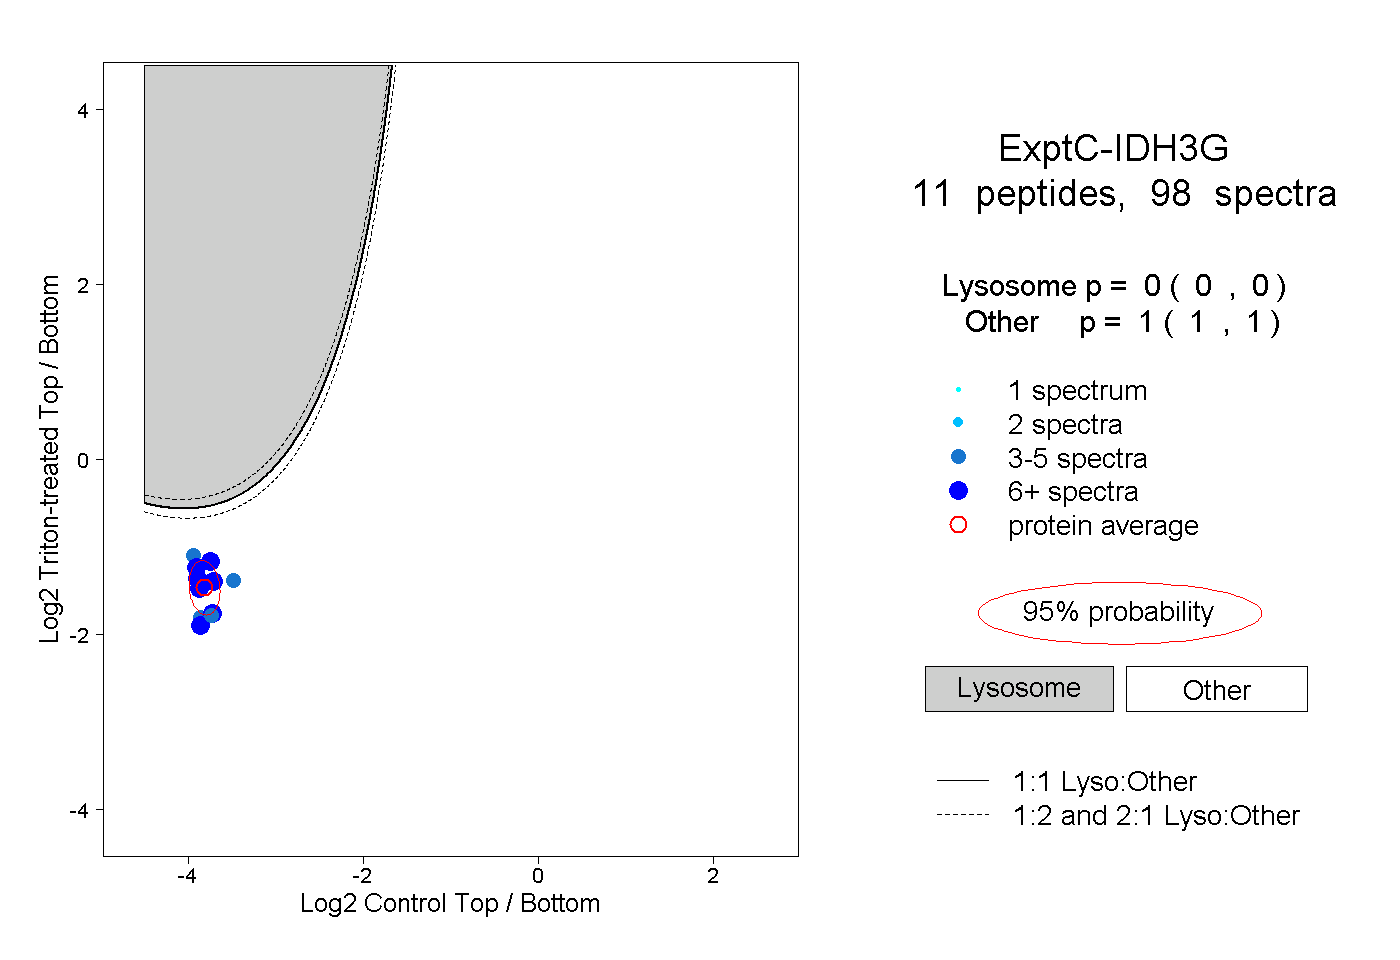
| Expt C |
11
peptides |
98
spectra |
 |
|
0.000
0.000 | 0.000 |
|
|
|
|
|
|
|
1.000
1.000 | 1.000 |
| | | Plot |
|
Lyso |
|
|
|
|
|
|
|
Other |
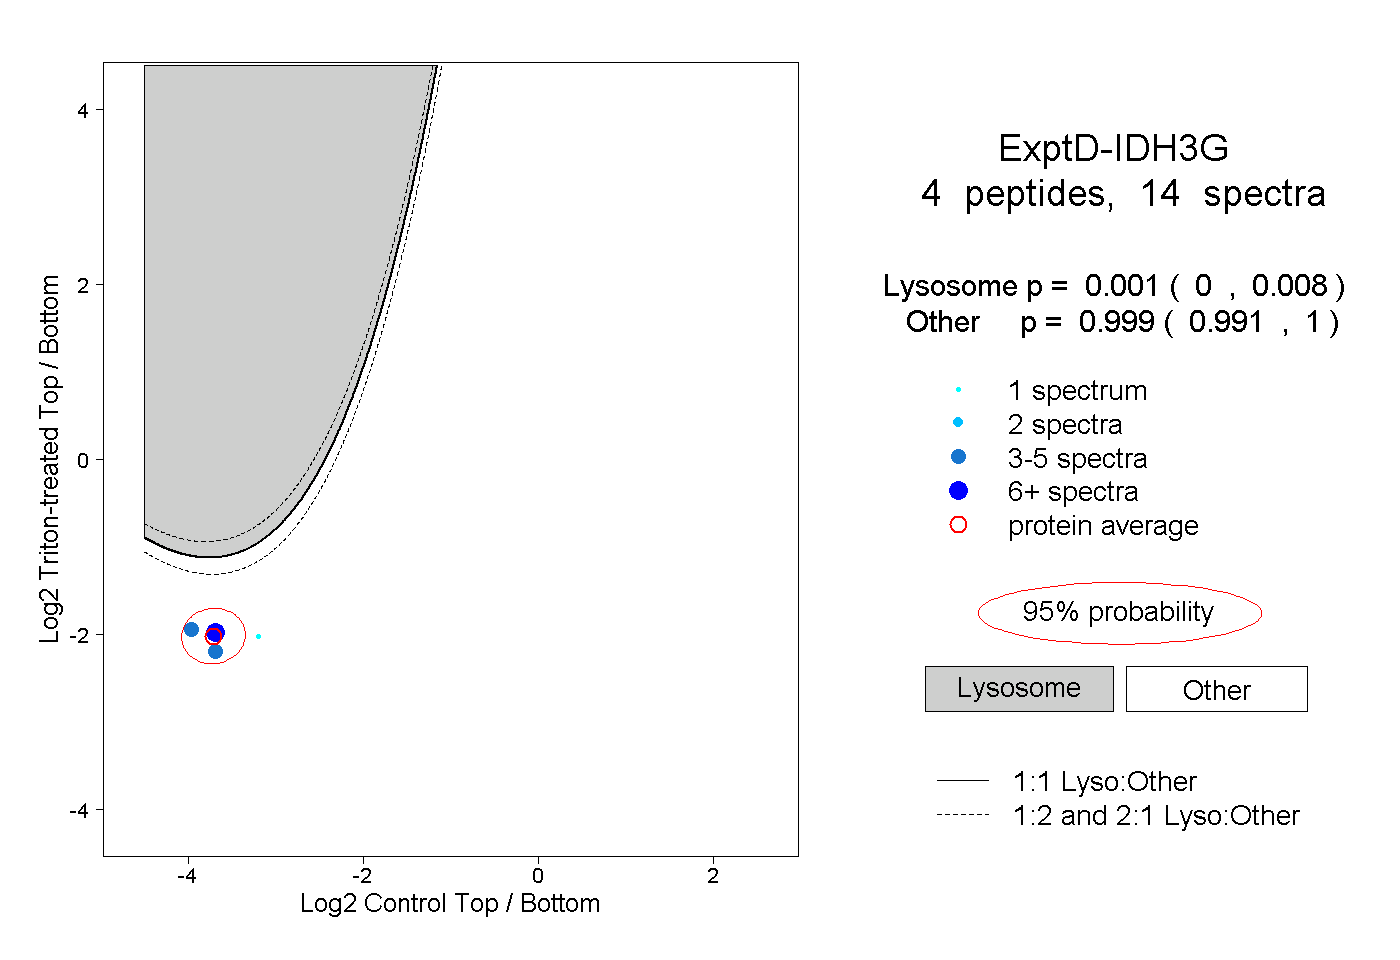
| Expt D |
4
peptides |
14
spectra |
 |
|
0.001
0.000 | 0.008 |
|
|
|
|
|
|
|
0.999
0.991 | 1.000 |