 3
3peptides
spectra
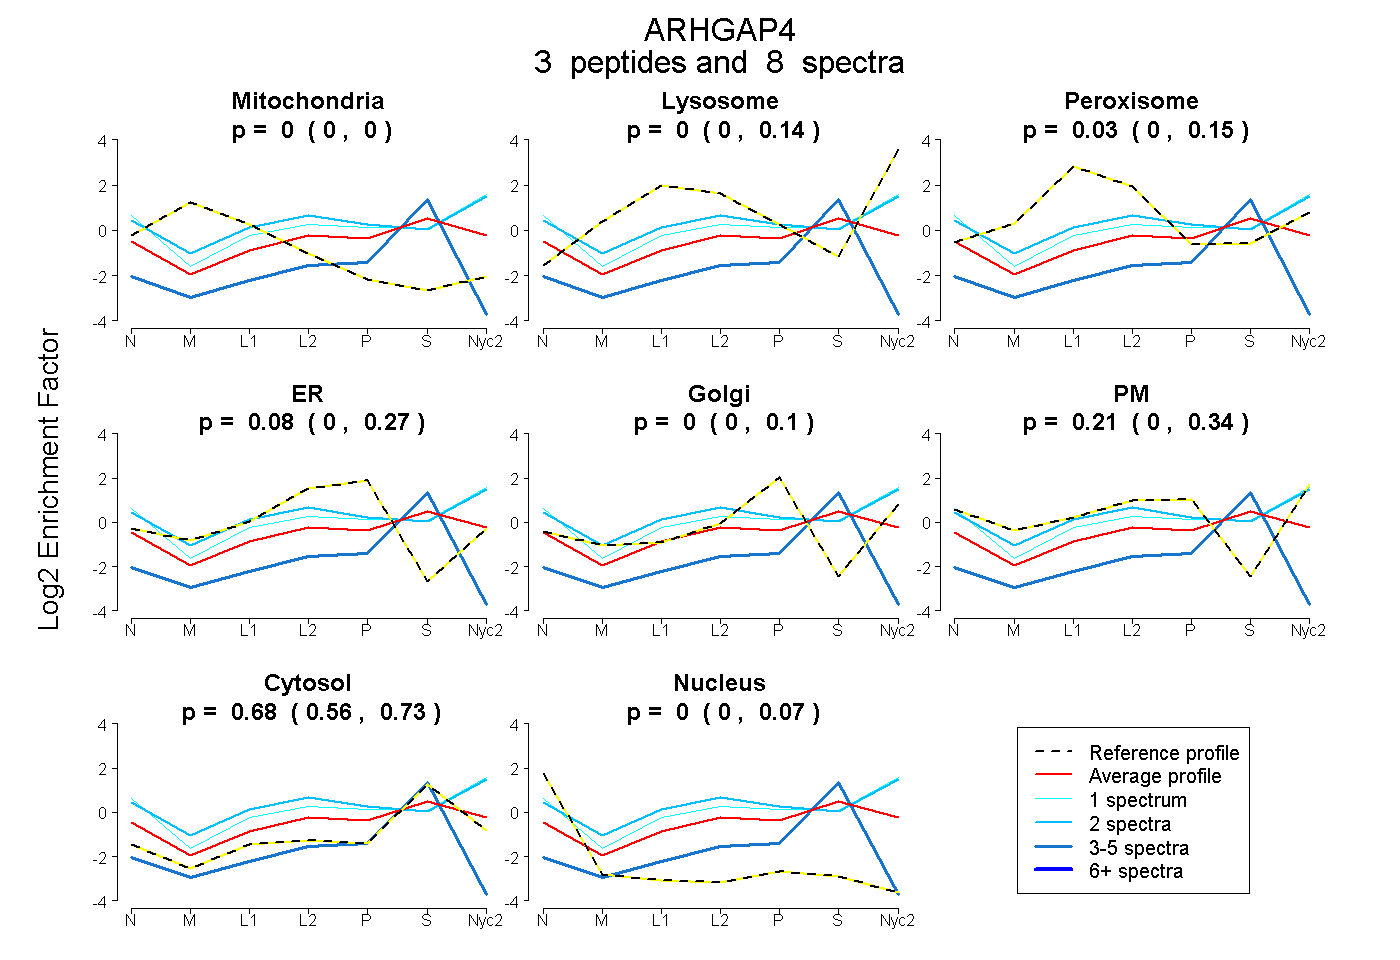
0.000 | 0.000
0.000 | 0.141
0.000 | 0.149
0.000 | 0.275
0.000 | 0.100
0.000 | 0.343
0.564 | 0.726
0.000 | 0.072
2peptides
spectra
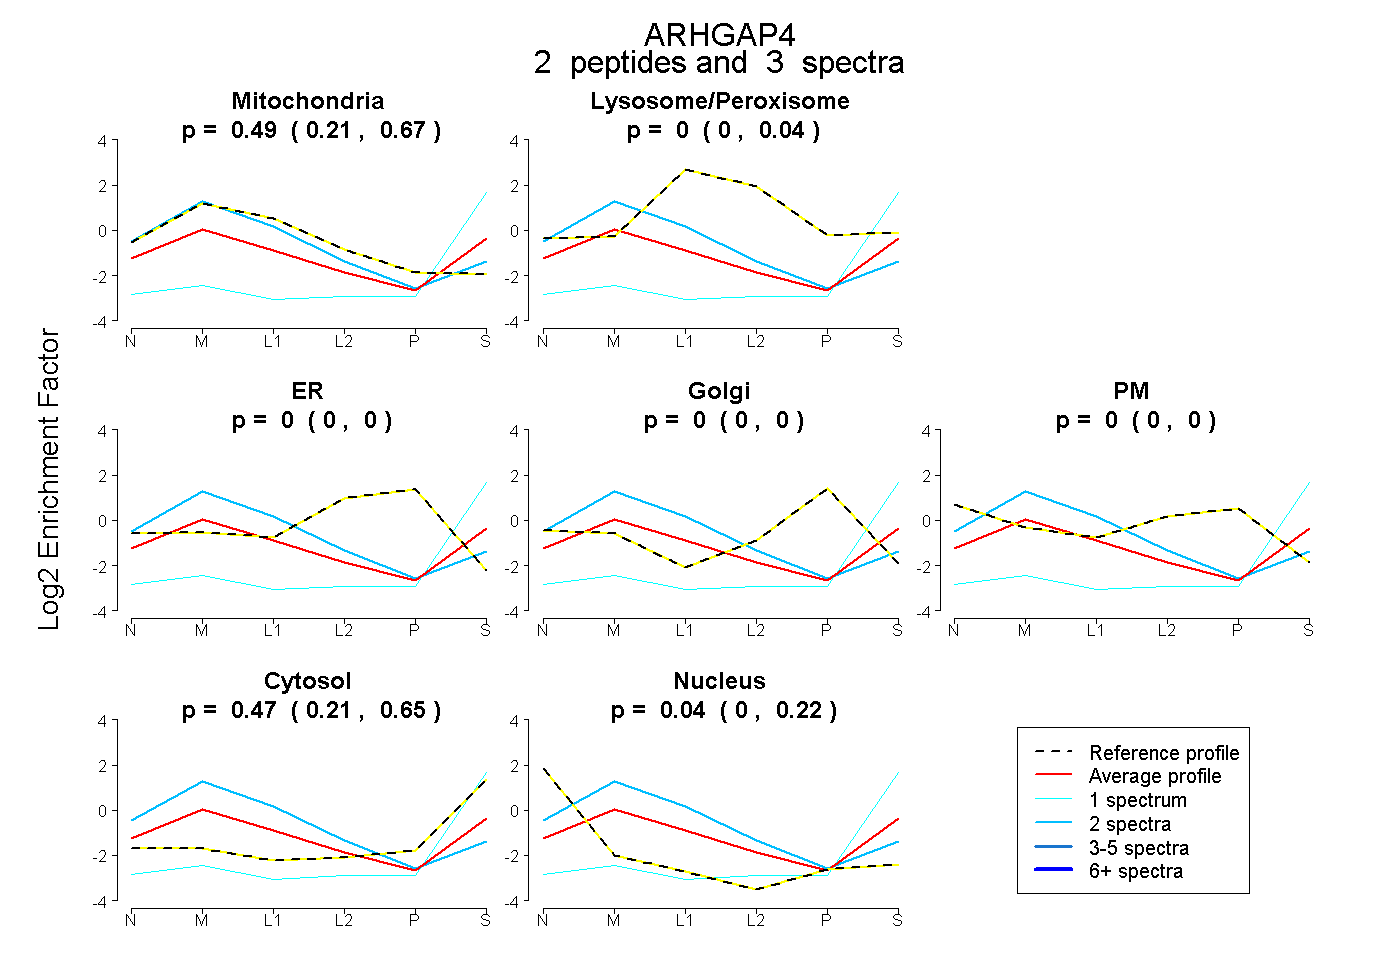
0.214 | 0.670
0.000 | 0.042
0.000 | 0.000
0.000 | 0.000
0.000 | 0.000
0.213 | 0.649
0.000 | 0.218
2peptides
spectra
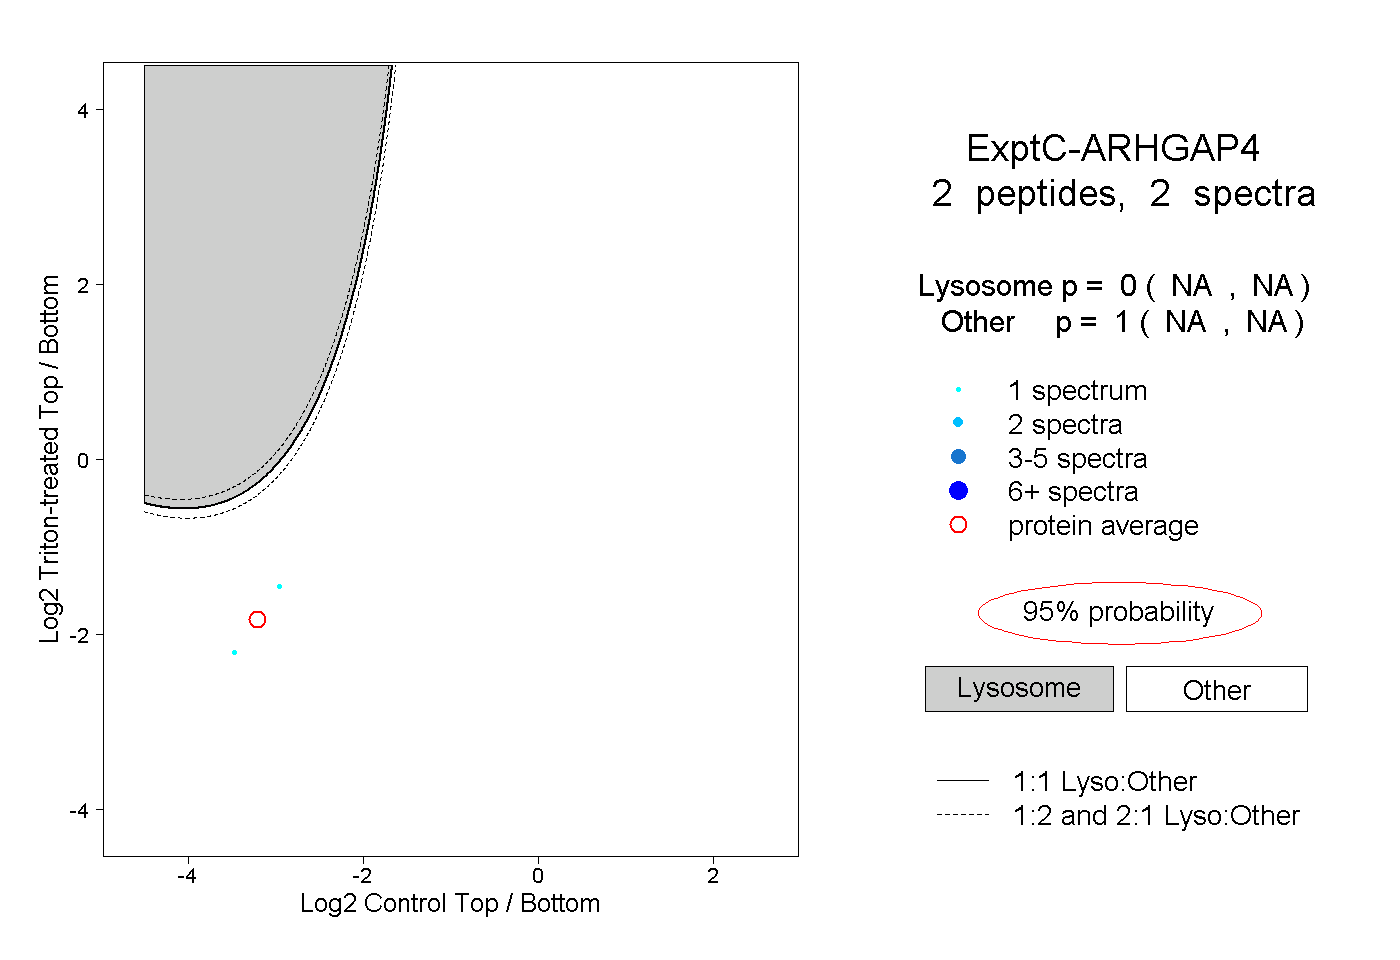
NA | NA
NA | NA
1peptide
spectra
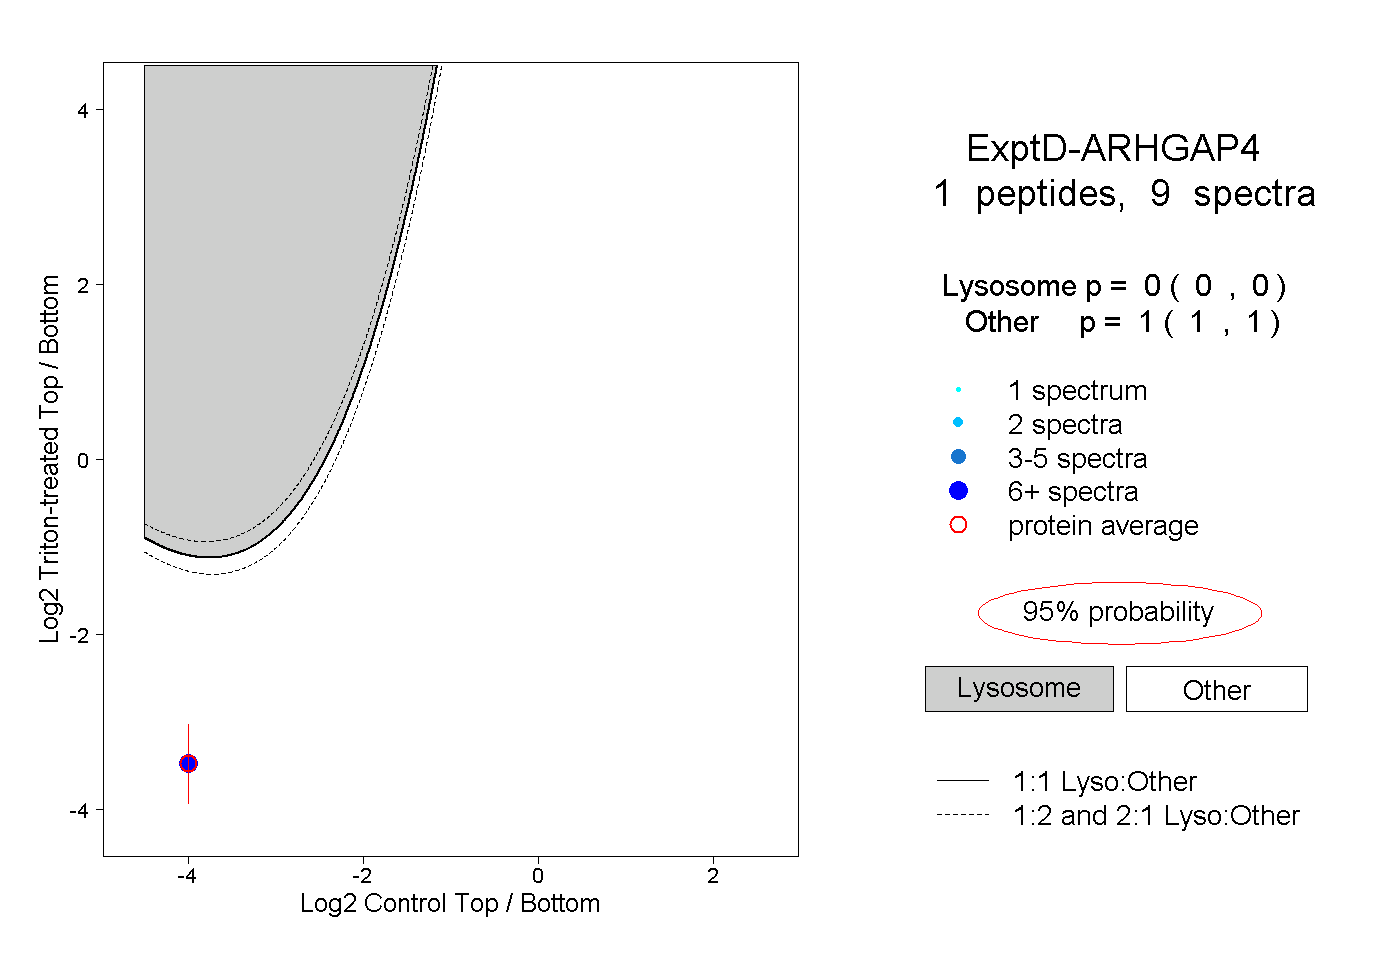
0.000 | 0.000
1.000 | 1.000