 3
3peptides
spectra
0.000 | 0.000
0.000 | 0.000
0.000 | 0.000
0.000 | 0.000
0.030 | 0.109
0.000 | 0.000
0.885 | 0.964
0.000 | 0.000
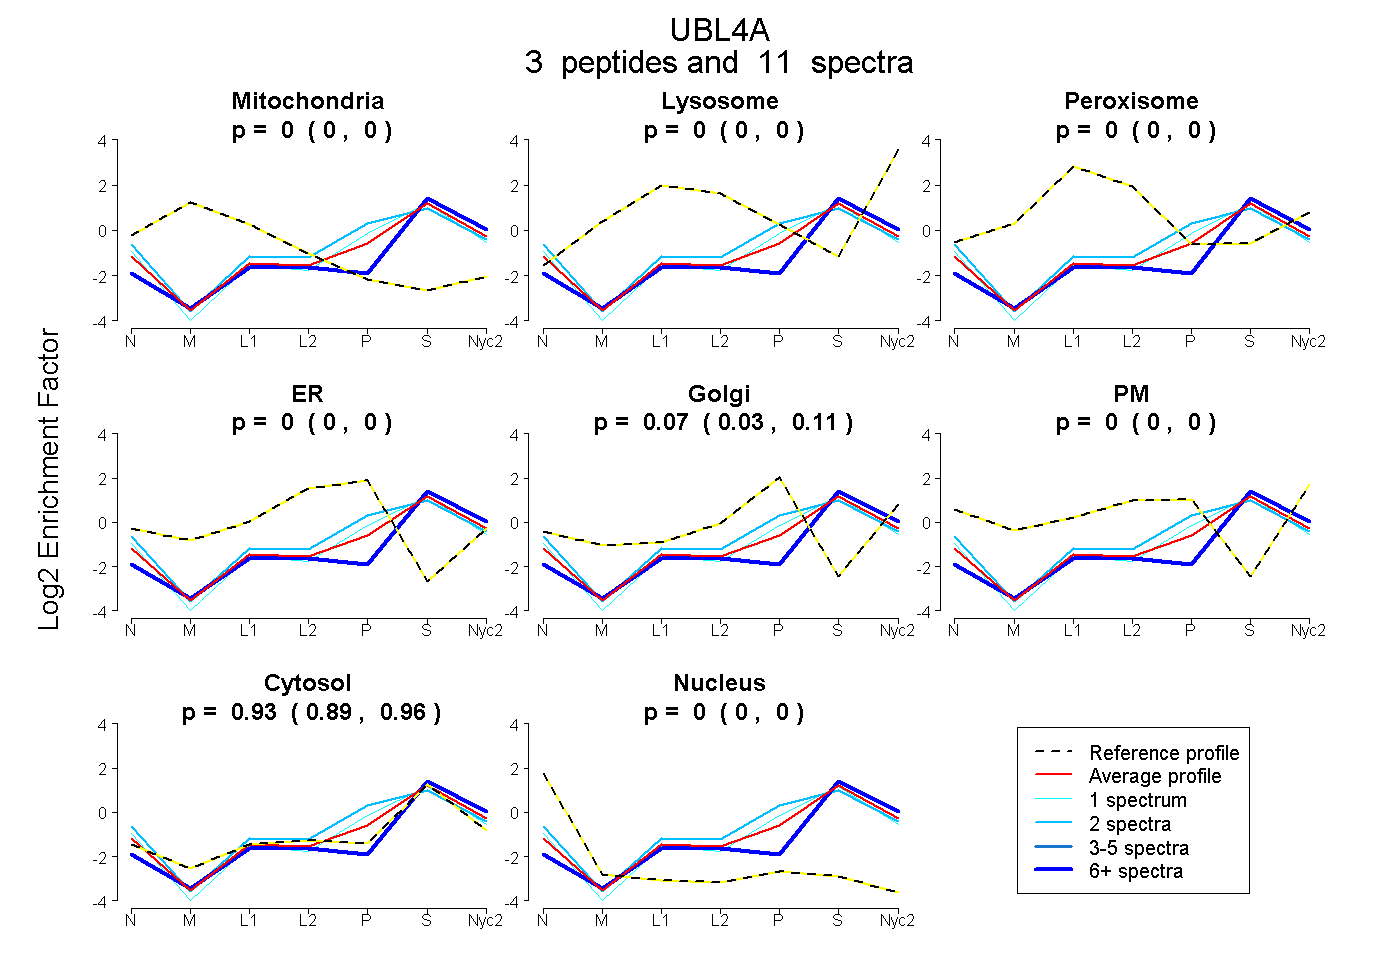
| Plot | Mito | Lyso | Perox | ER | Golgi | PM | Cytosol | Nucleus | |||||
| Expt A |
3 peptides |
11 spectra |
|
0.000 0.000 | 0.000 |
0.000 0.000 | 0.000 |
0.000 0.000 | 0.000 |
0.000 0.000 | 0.000 |
0.071 0.030 | 0.109 |
0.000 0.000 | 0.000 |
0.929 0.885 | 0.964 |
0.000 0.000 | 0.000 |
| 8 spectra, QLTVK | 0.000 | 0.000 | 0.000 | 0.000 | 0.000 | 0.000 | 1.000 | 0.000 | ||
| 1 spectrum, LNVPVR | 0.000 | 0.000 | 0.000 | 0.000 | 0.080 | 0.000 | 0.908 | 0.012 | ||
| 2 spectra, LTLDDIER | 0.000 | 0.000 | 0.000 | 0.000 | 0.210 | 0.000 | 0.790 | 0.000 |
| Plot | Lyso | Other | |||||||||||
| Expt C |
2 peptides |
3 spectra |
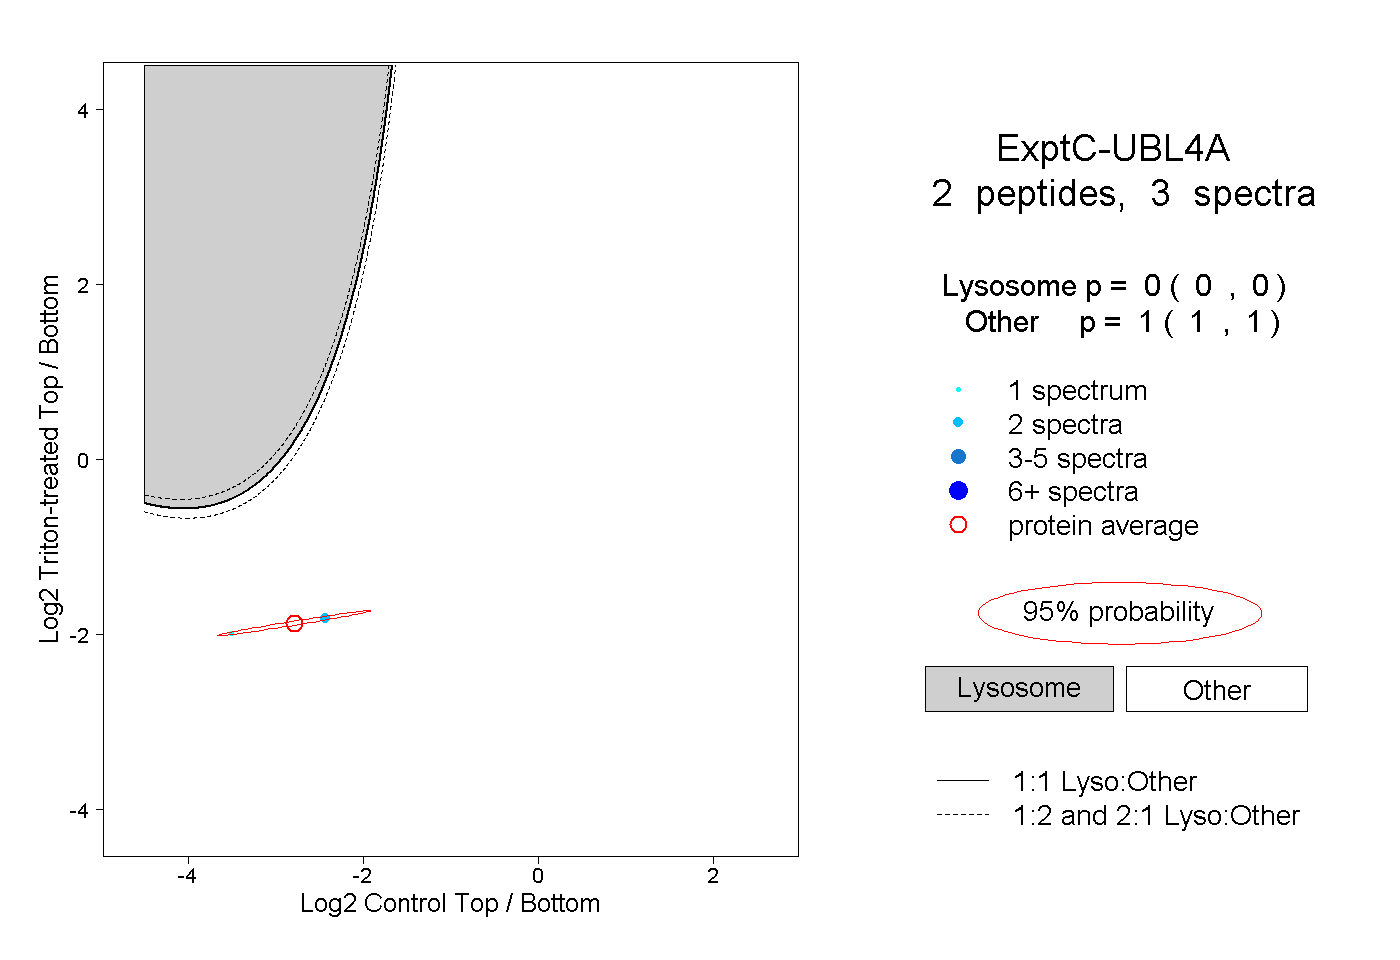 |
0.000 0.000 | 0.000 |
1.000 1.000 | 1.000 |
||||||||
| Plot | Lyso | Other | |||||||||||
| Expt D |
1 peptide |
2 spectra |
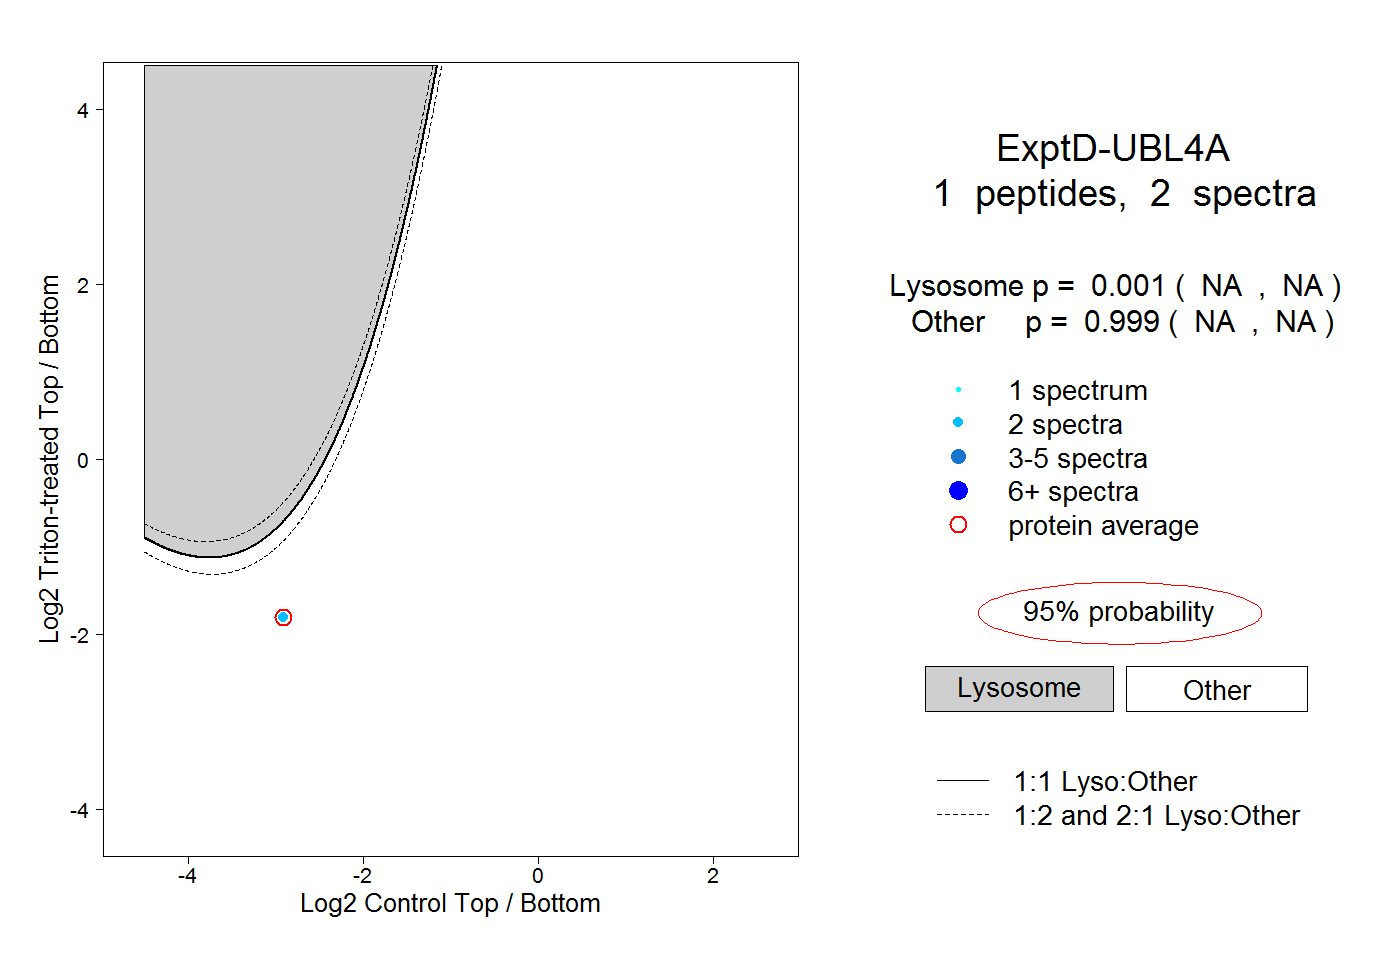 |
0.001 NA | NA |
0.999 NA | NA |