 1
1peptide
spectra
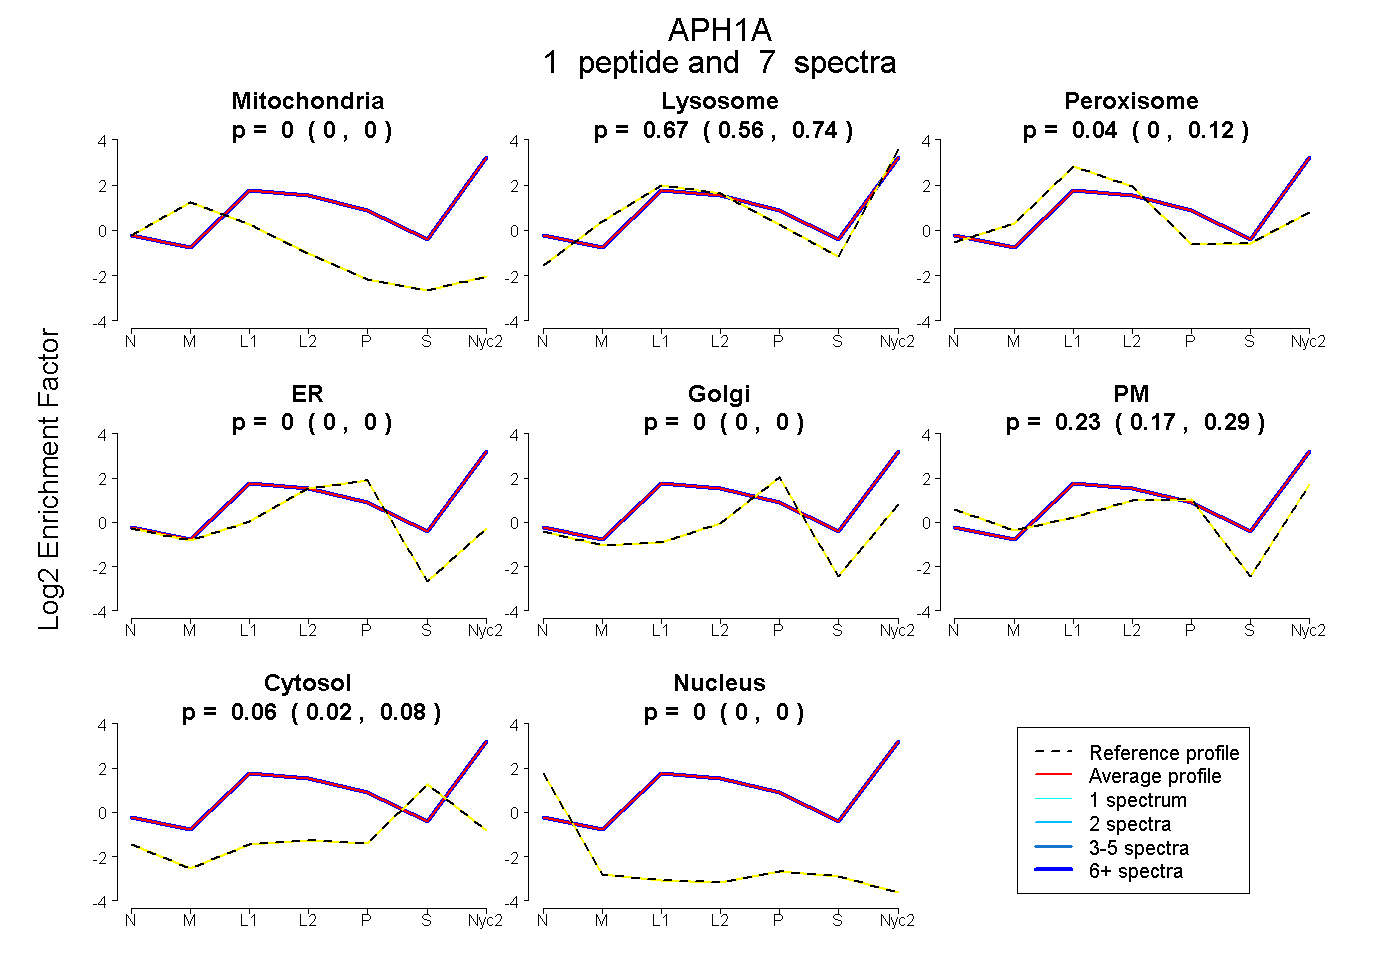
0.000 | 0.000
0.561 | 0.743
0.000 | 0.120
0.000 | 0.000
0.000 | 0.000
0.168 | 0.285
0.023 | 0.084
0.000 | 0.000
3peptides
spectra
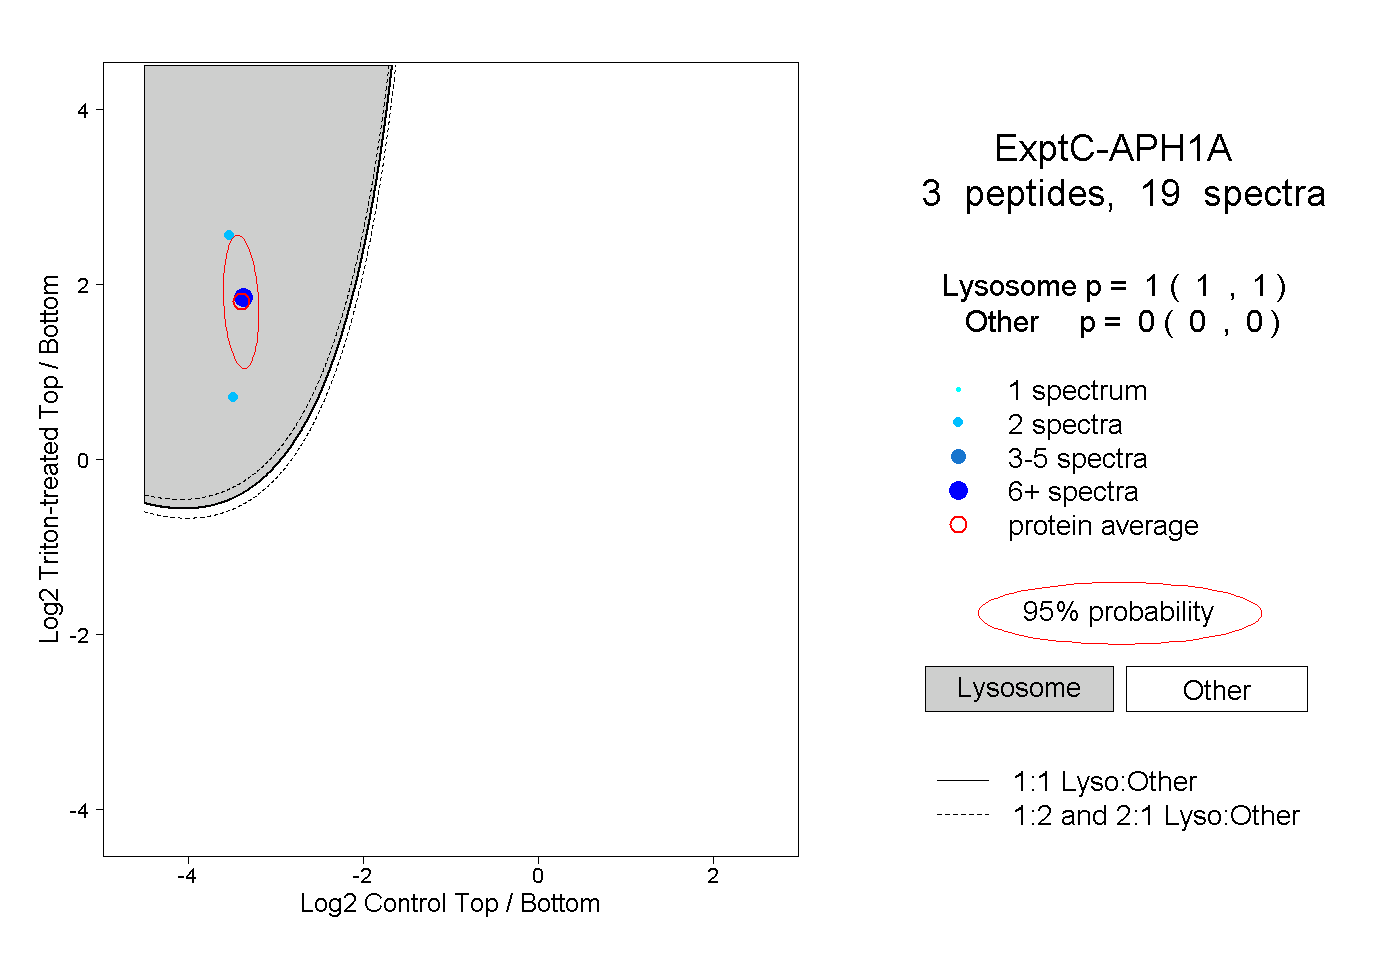
1.000 | 1.000
0.000 | 0.000
1peptide
spectra
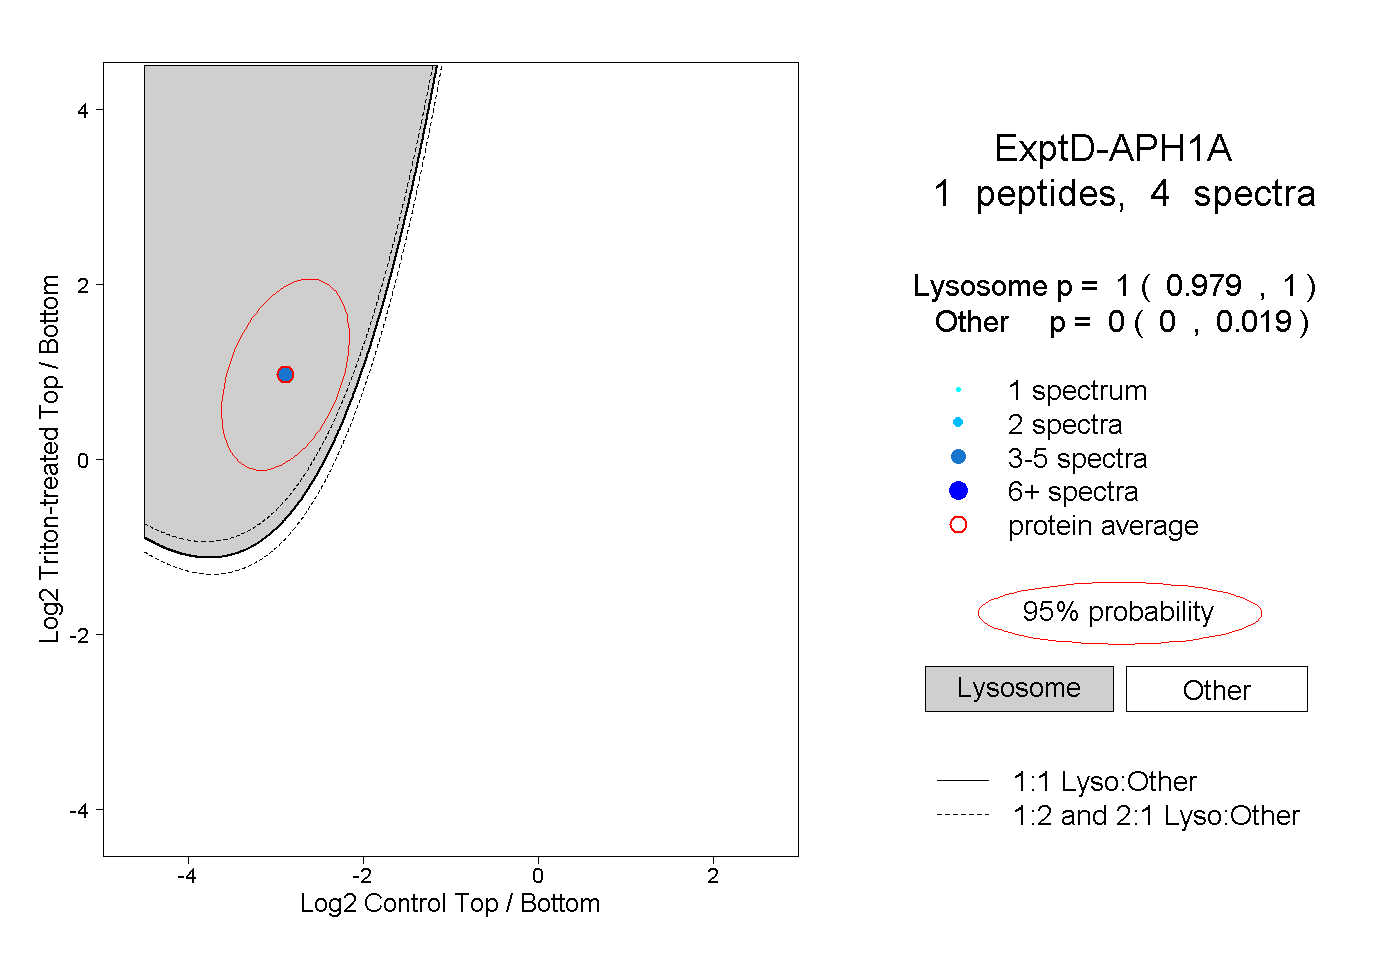
0.979 | 1.000
0.000 | 0.019