 5
5peptides
spectra
0.000 | 0.000
0.000 | 0.000
0.000 | 0.000
0.483 | 0.687
0.000 | 0.225
0.000 | 0.000
0.000 | 0.088
0.212 | 0.285
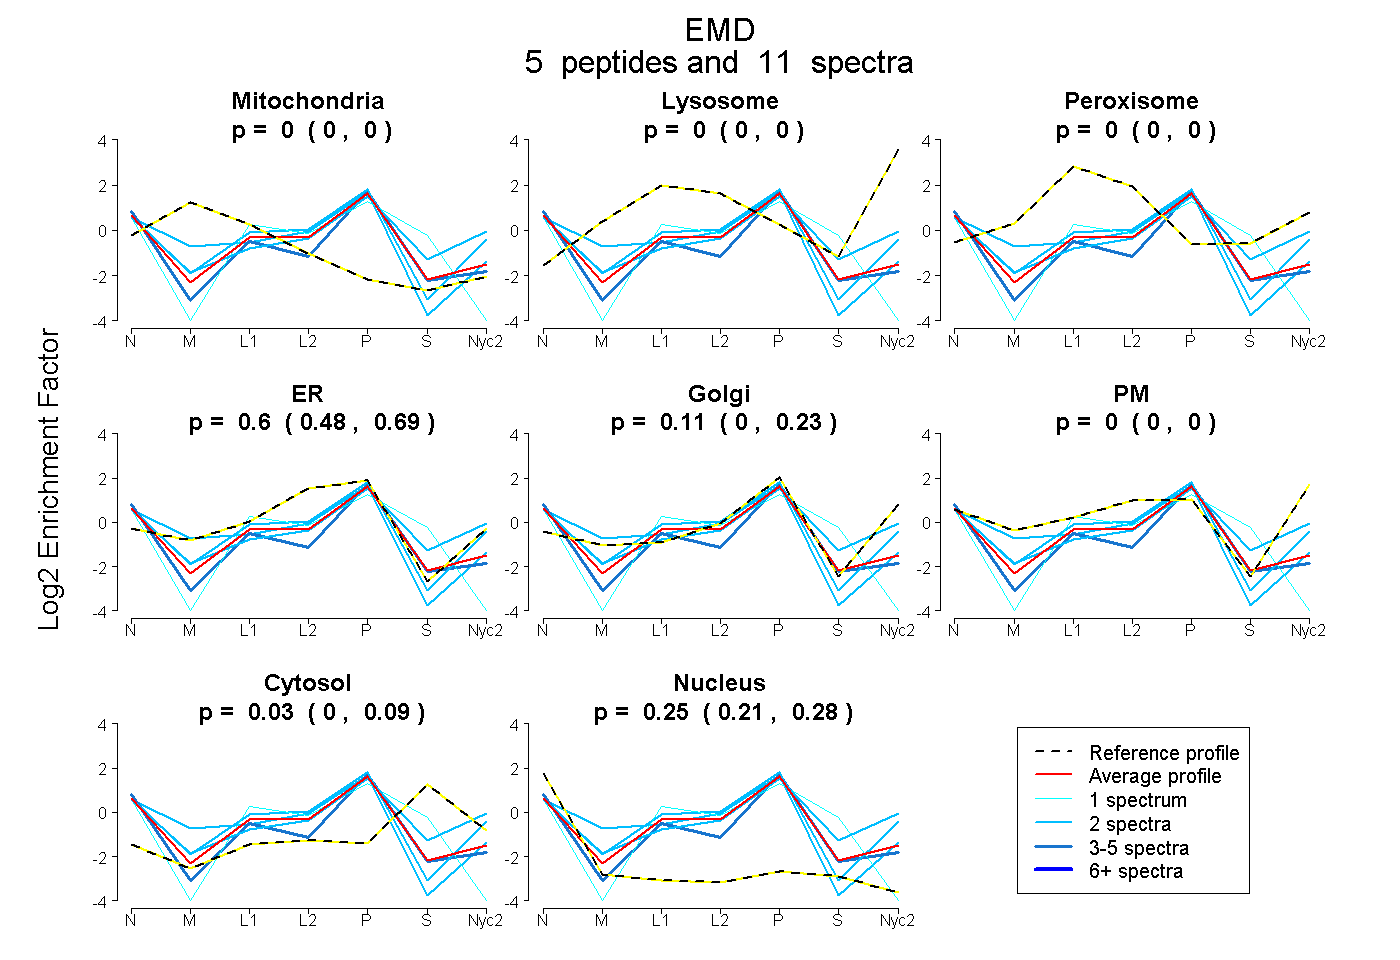
| Plot | Mito | Lyso | Perox | ER | Golgi | PM | Cytosol | Nucleus | |||||
| Expt A |
5 peptides |
11 spectra |
|
0.000 0.000 | 0.000 |
0.000 0.000 | 0.000 |
0.000 0.000 | 0.000 |
0.599 0.483 | 0.687 |
0.113 0.000 | 0.225 |
0.000 0.000 | 0.000 |
0.033 0.000 | 0.088 |
0.255 0.212 | 0.285 |
| 2 spectra, QYNIPHGPIVGSTR | 0.000 | 0.000 | 0.000 | 0.543 | 0.312 | 0.000 | 0.000 | 0.145 | ||
| 2 spectra, AIRPEK | 0.008 | 0.000 | 0.000 | 0.745 | 0.032 | 0.000 | 0.000 | 0.215 | ||
| 1 spectrum, RPGTSLVDADDTFHHQVR | 0.000 | 0.000 | 0.000 | 0.410 | 0.000 | 0.000 | 0.335 | 0.255 | ||
| 4 spectra, LSPPSSSSSSFSYR | 0.000 | 0.000 | 0.000 | 0.367 | 0.276 | 0.000 | 0.009 | 0.348 | ||
| 2 spectra, TYGEPESVGMSK | 0.000 | 0.000 | 0.000 | 0.111 | 0.546 | 0.075 | 0.177 | 0.091 |
| Plot | Mito | Lyso or Perox | ER | Golgi | PM | Cytosol | Nucleus | ||||||
| Expt B |
1 peptide |
1 spectrum |
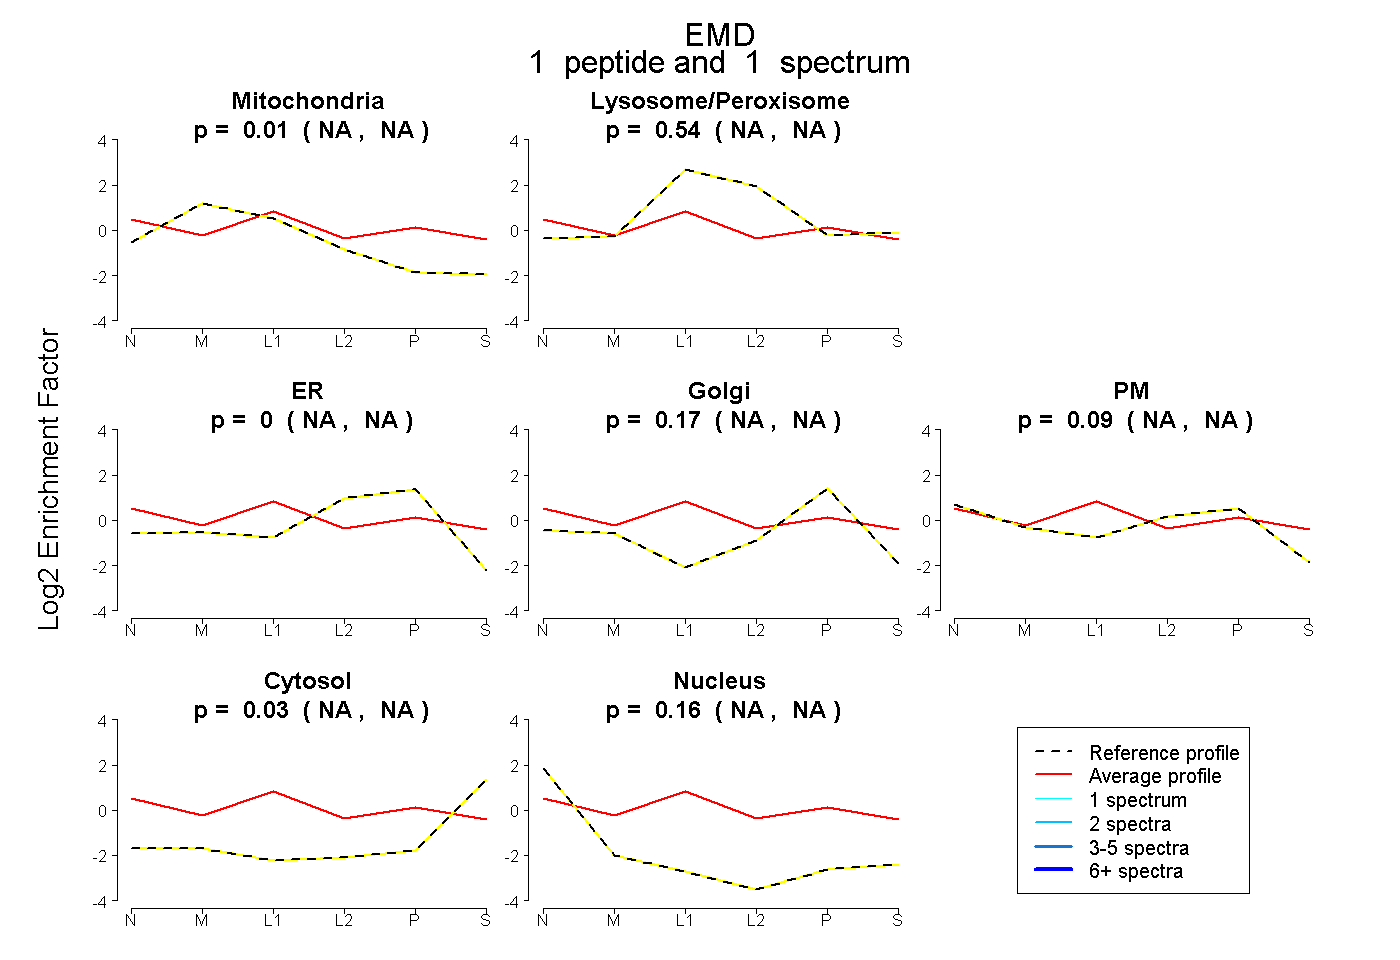 |
0.008 NA | NA |
0.541 NA | NA |
0.000 NA | NA |
0.174 NA | NA |
0.086 NA | NA |
0.030 NA | NA |
0.160 NA | NA |
|||
| Plot | Lyso | Other | |||||||||||
| Expt C |
3 peptides |
9 spectra |
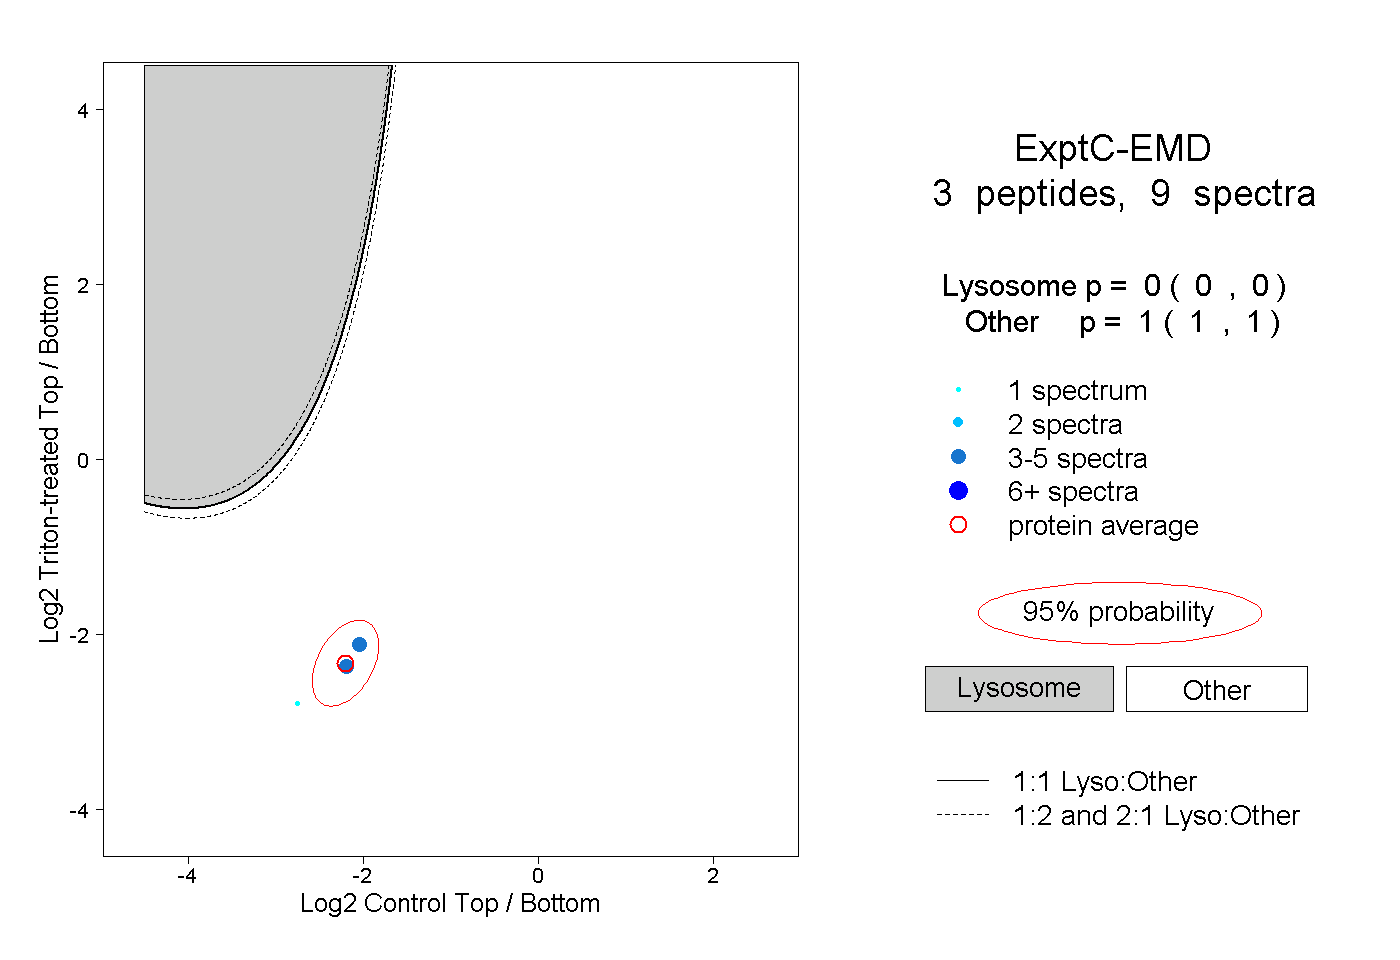 |
0.000 0.000 | 0.000 |
1.000 1.000 | 1.000 |
||||||||
| Plot | Lyso | Other | |||||||||||
| Expt D |
1 peptide |
2 spectra |
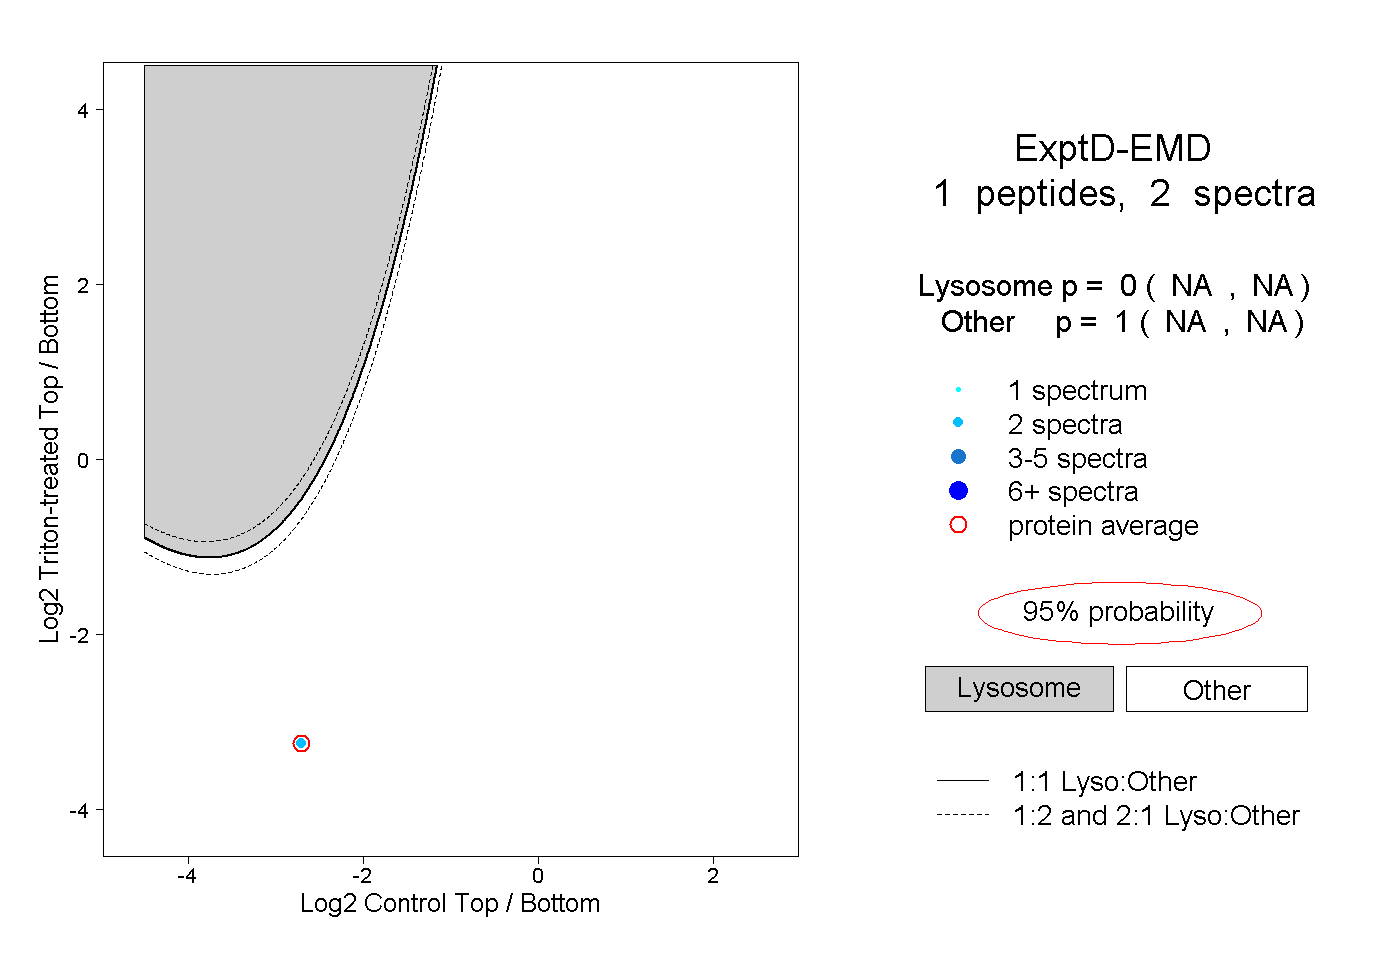 |
0.000 NA | NA |
1.000 NA | NA |