 2
2peptides
spectra
NA | NA
NA | NA
NA | NA
NA | NA
NA | NA
NA | NA
NA | NA
NA | NA
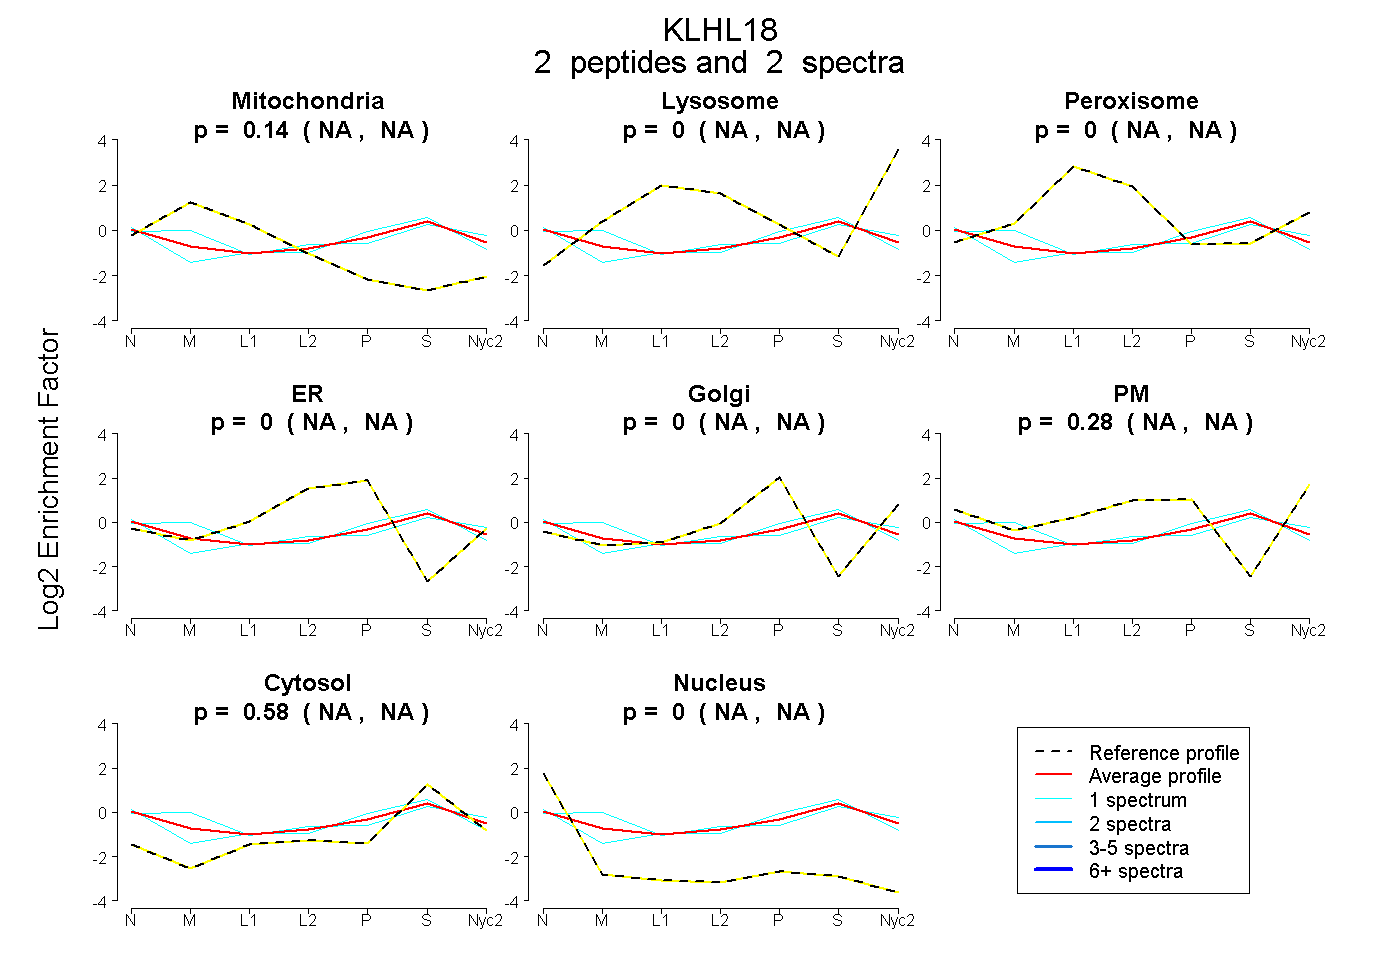
| Plot | Mito | Lyso | Perox | ER | Golgi | PM | Cytosol | Nucleus | |||||
| Expt A |
2 peptides |
2 spectra |
|
0.141 NA | NA |
0.000 NA | NA |
0.000 NA | NA |
0.000 NA | NA |
0.001 NA | NA |
0.278 NA | NA |
0.580 NA | NA |
0.000 NA | NA |
| 1 spectrum, VQQDDLVR | 0.000 | 0.000 | 0.065 | 0.041 | 0.110 | 0.110 | 0.590 | 0.084 | ||
| 1 spectrum, RPHLPAFR | 0.216 | 0.008 | 0.000 | 0.000 | 0.000 | 0.287 | 0.489 | 0.000 |