 4
4peptides
spectra
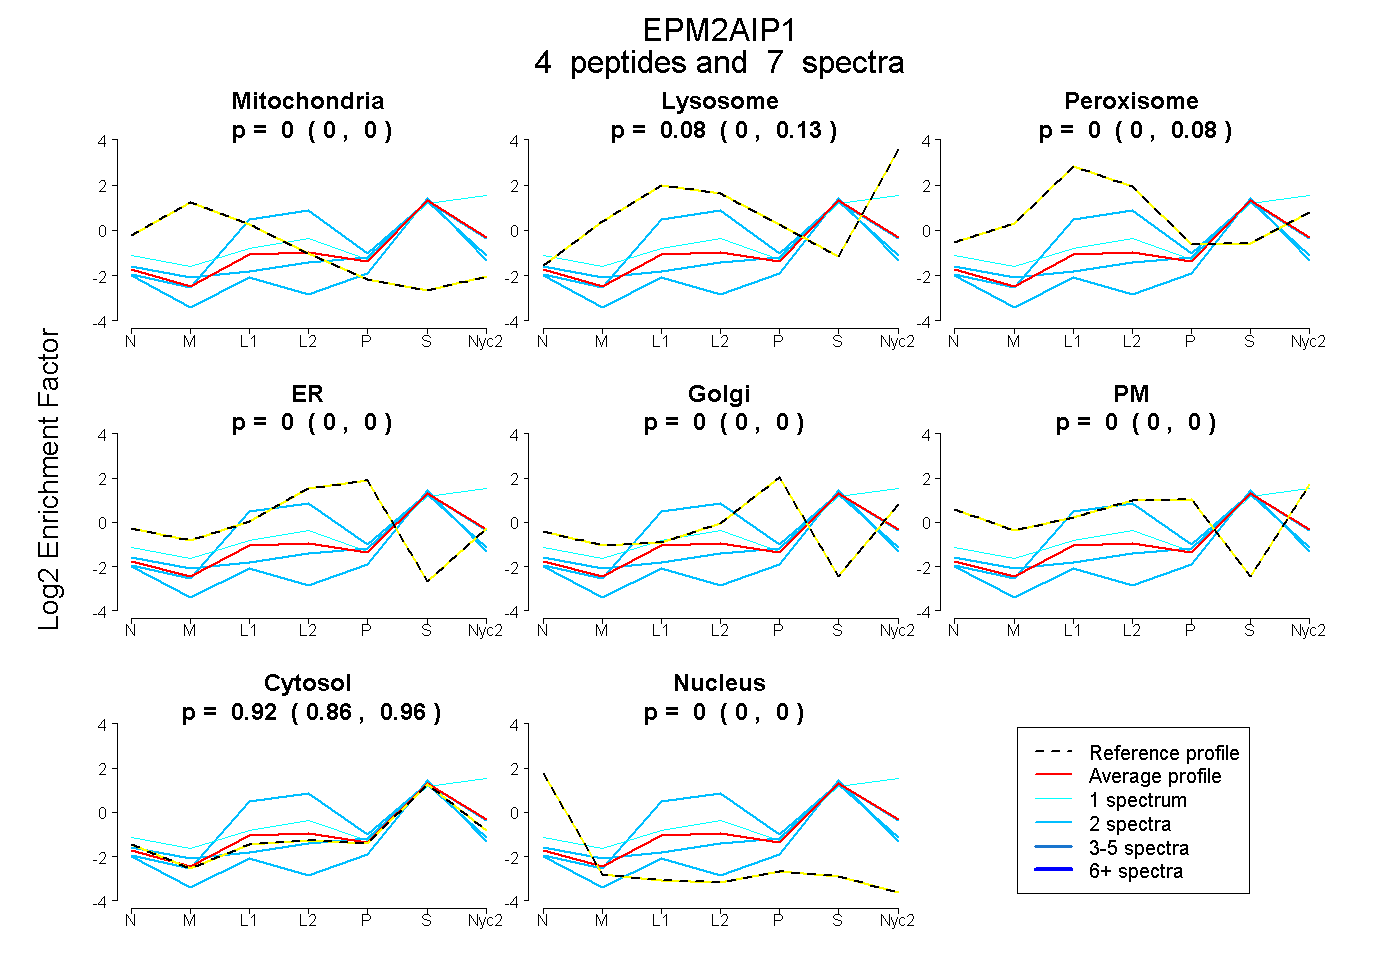
0.000 | 0.000
0.000 | 0.127
0.000 | 0.083
0.000 | 0.000
0.000 | 0.000
0.000 | 0.000
0.855 | 0.961
0.000 | 0.000
| Plot | Mito | Lyso | Perox | ER | Golgi | PM | Cytosol | Nucleus | |||||
| Expt A |
4 peptides |
7 spectra |
|
0.000 0.000 | 0.000 |
0.083 0.000 | 0.127 |
0.000 0.000 | 0.083 |
0.000 0.000 | 0.000 |
0.000 0.000 | 0.000 |
0.000 0.000 | 0.000 |
0.917 0.855 | 0.961 |
0.000 0.000 | 0.000 |
| 2 spectra, MVGLTTTHTLR | 0.024 | 0.000 | 0.000 | 0.000 | 0.000 | 0.000 | 0.971 | 0.005 | ||
| 2 spectra, AGLGLCR | 0.000 | 0.000 | 0.358 | 0.000 | 0.000 | 0.000 | 0.642 | 0.000 | ||
| 1 spectrum, ILSIDSNLR | 0.000 | 0.321 | 0.000 | 0.000 | 0.000 | 0.000 | 0.679 | 0.000 | ||
| 2 spectra, HYEAEHEFYER | 0.000 | 0.000 | 0.000 | 0.000 | 0.000 | 0.000 | 0.914 | 0.086 |
| Plot | Lyso | Other | |||||||||||
| Expt C |
3 peptides |
3 spectra |
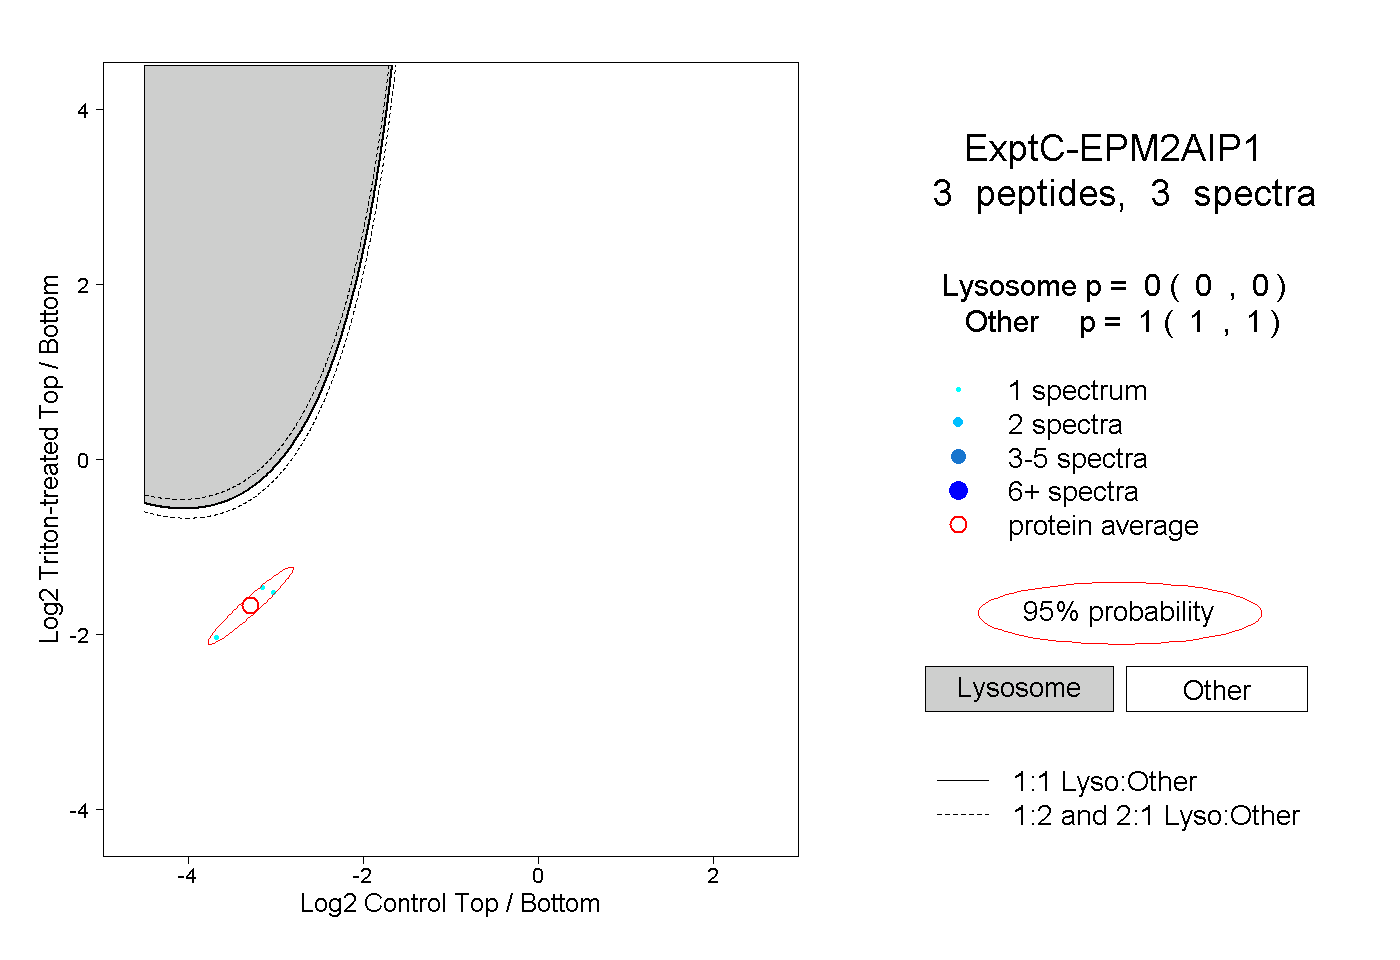 |
0.000 0.000 | 0.000 |
1.000 1.000 | 1.000 |