 7
7peptides
spectra
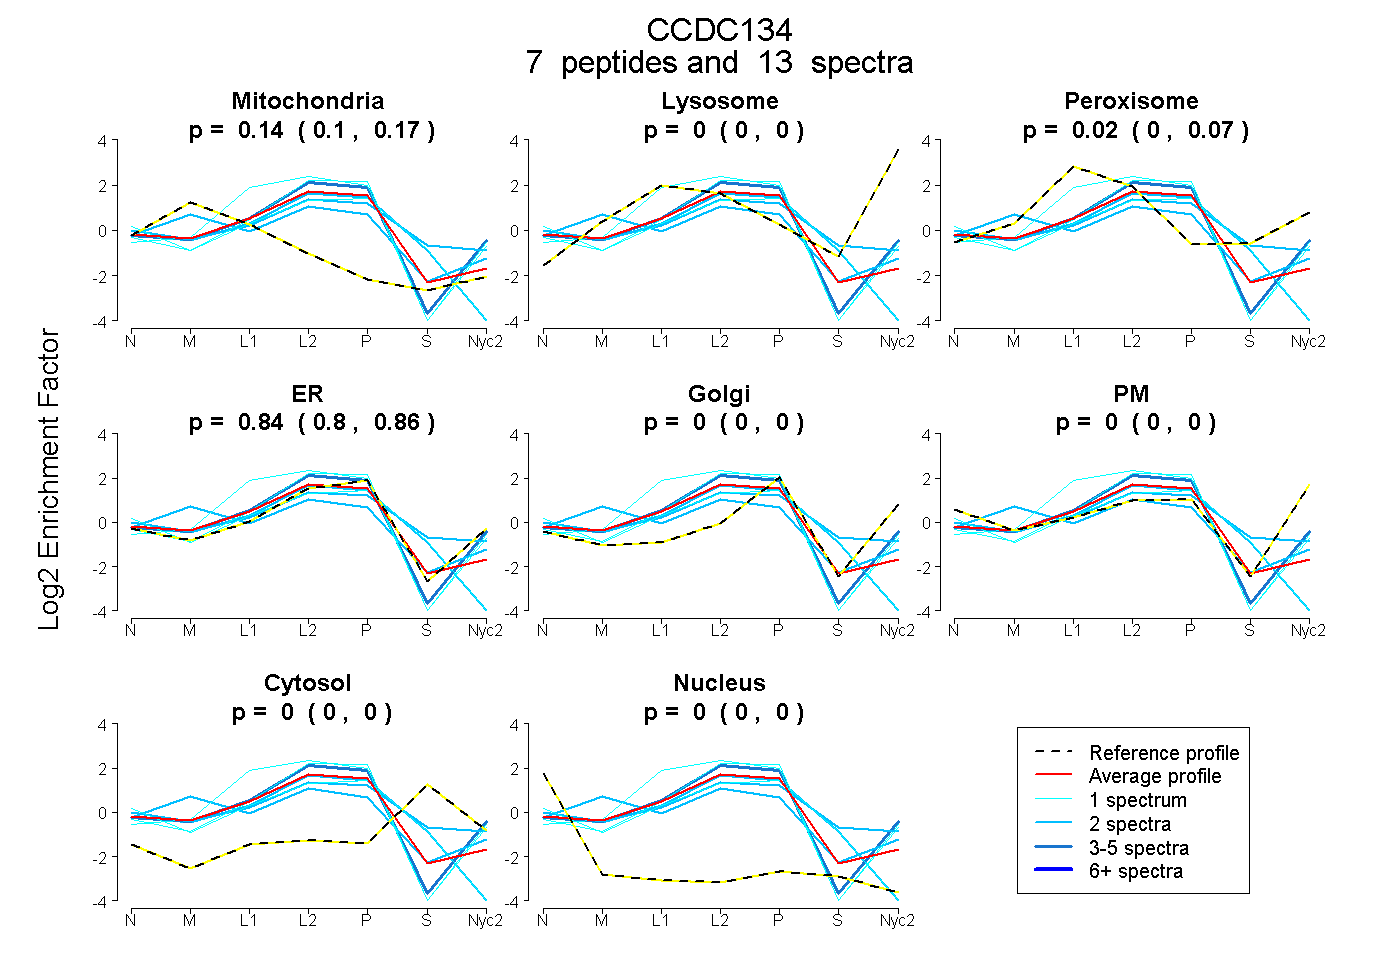
0.103 | 0.168
0.000 | 0.000
0.000 | 0.065
0.800 | 0.858
0.000 | 0.000
0.000 | 0.000
0.000 | 0.000
0.000 | 0.000
4peptides
spectra
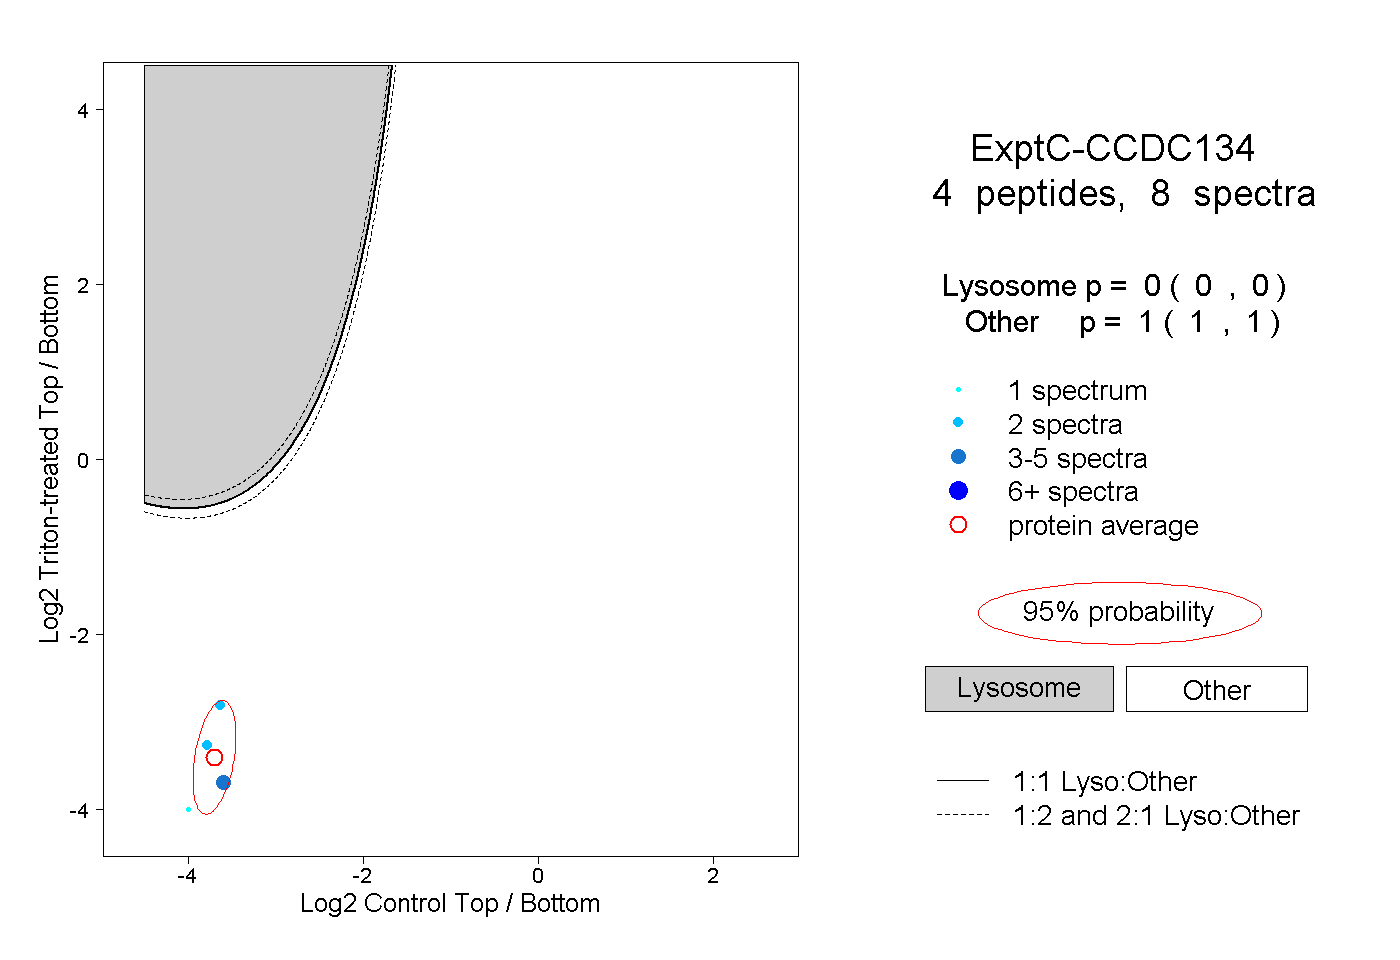
0.000 | 0.000
1.000 | 1.000
1peptide
spectrum
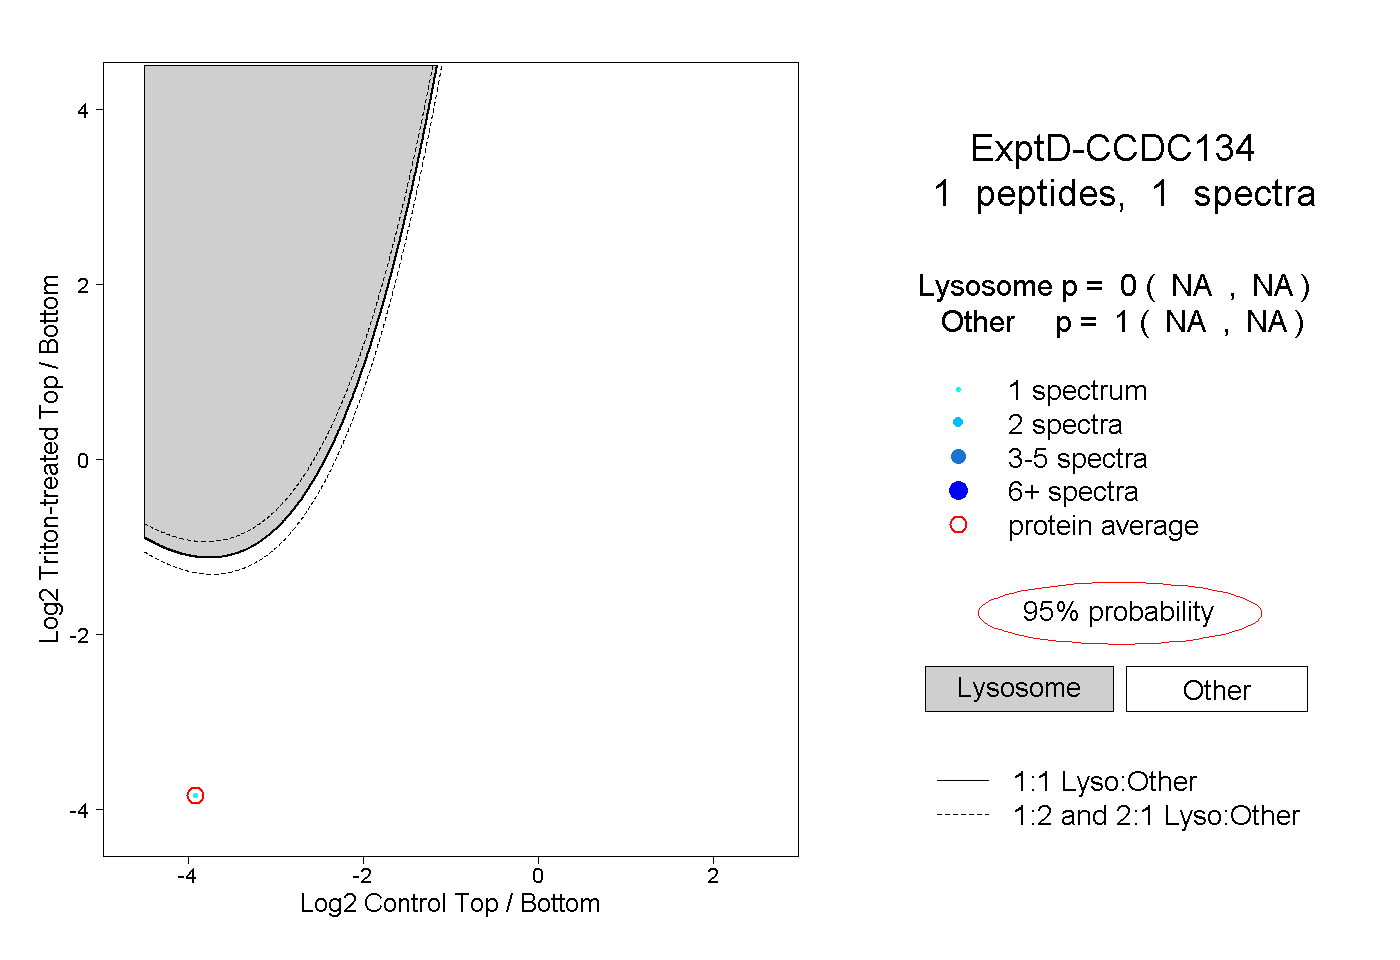
NA | NA
NA | NA