 3
3peptides
spectra
0.000 | 0.000
0.000 | 0.000
0.000 | 0.000
0.000 | 0.134
0.025 | 0.201
0.000 | 0.014
0.634 | 0.666
0.131 | 0.183
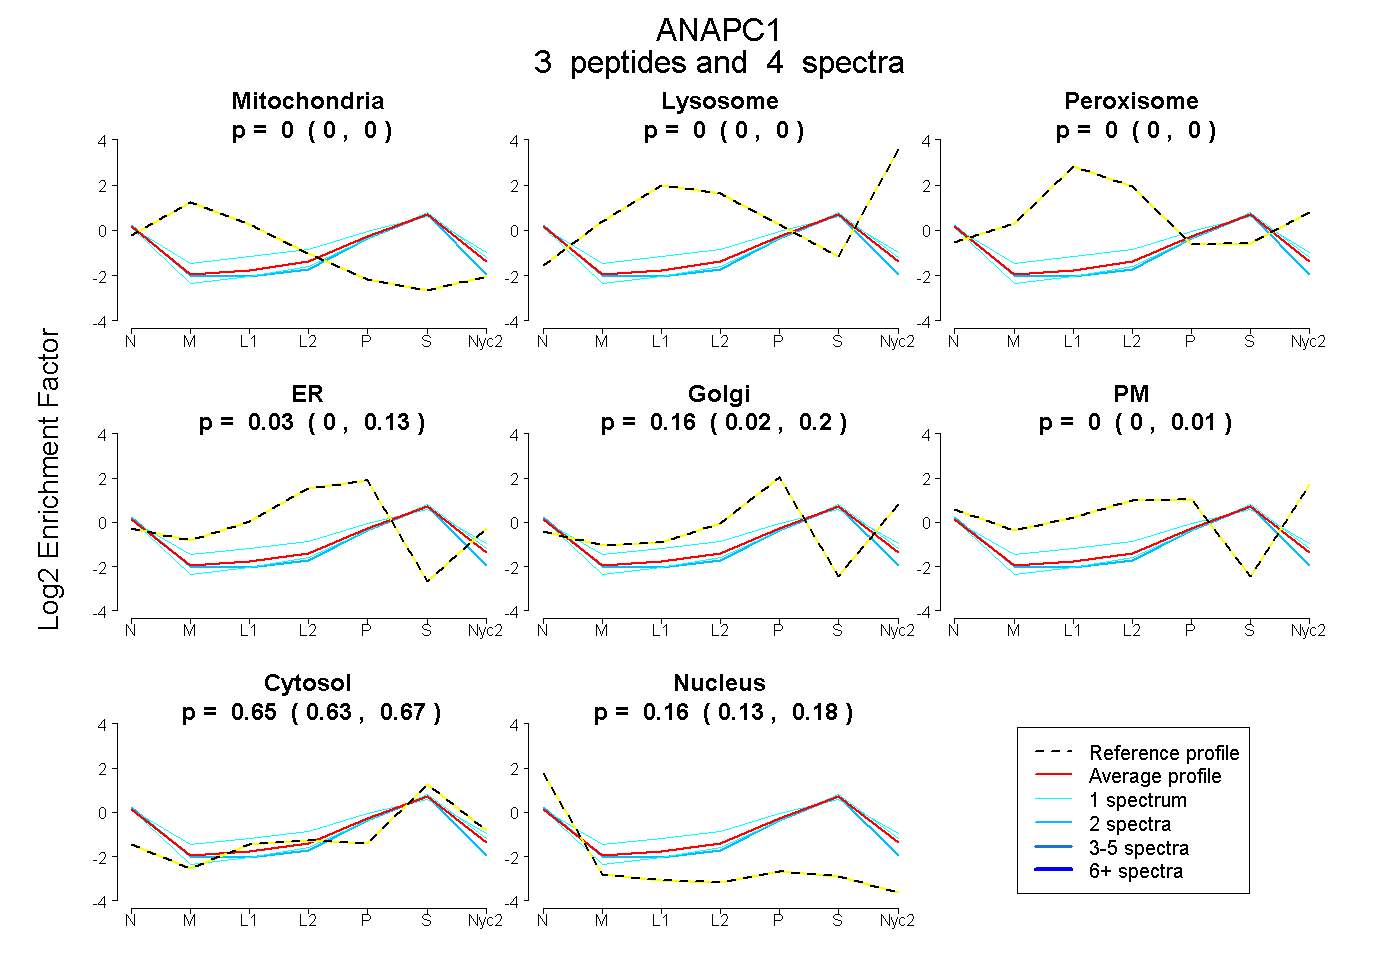
| Plot | Mito | Lyso | Perox | ER | Golgi | PM | Cytosol | Nucleus | |||||
| Expt A |
3 peptides |
4 spectra |
|
0.000 0.000 | 0.000 |
0.000 0.000 | 0.000 |
0.000 0.000 | 0.000 |
0.028 0.000 | 0.134 |
0.161 0.025 | 0.201 |
0.000 0.000 | 0.014 |
0.652 0.634 | 0.666 |
0.159 0.131 | 0.183 |