 64
64peptides
spectra
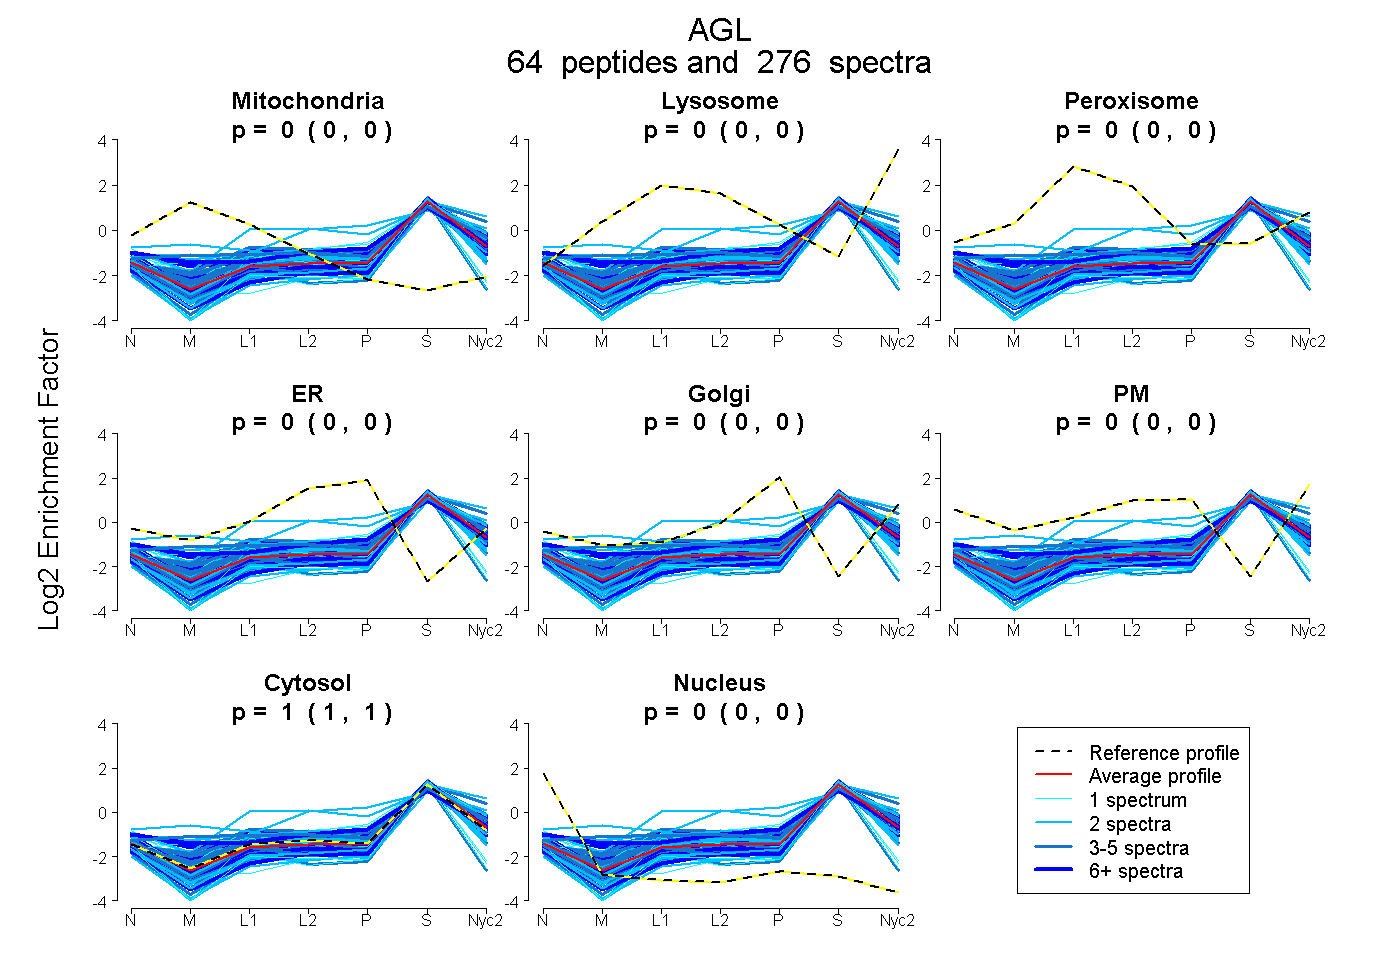
0.000 | 0.000
0.000 | 0.000
0.000 | 0.000
0.000 | 0.000
0.000 | 0.000
0.000 | 0.000
0.996 | 0.997
0.003 | 0.004
47peptides
spectra
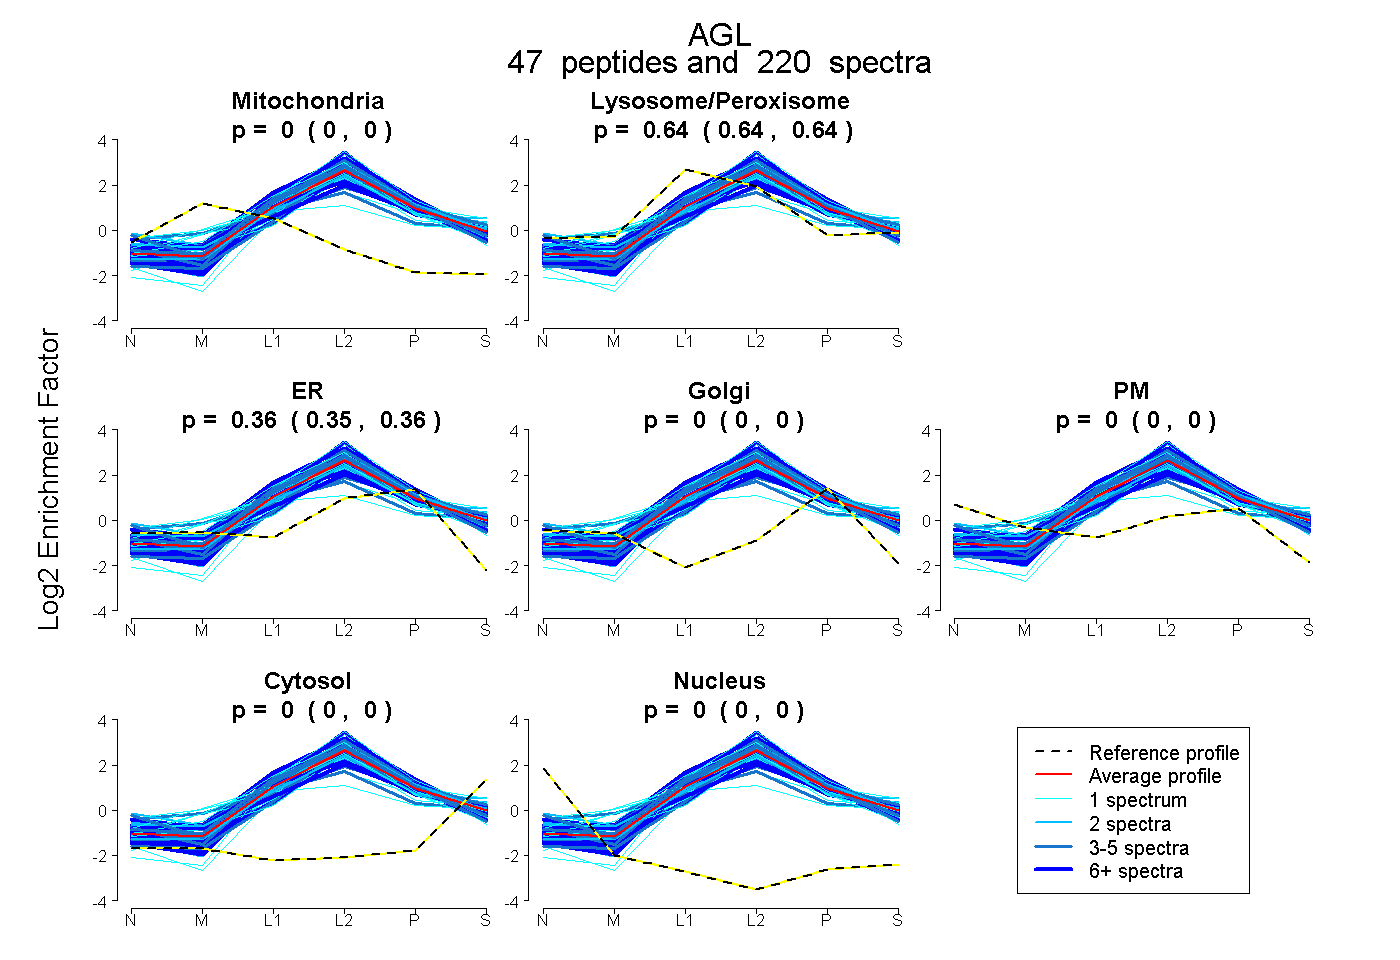
0.000 | 0.000
0.639 | 0.642
0.354 | 0.357
0.000 | 0.000
0.000 | 0.000
0.003 | 0.005
0.000 | 0.000
51peptides
spectra
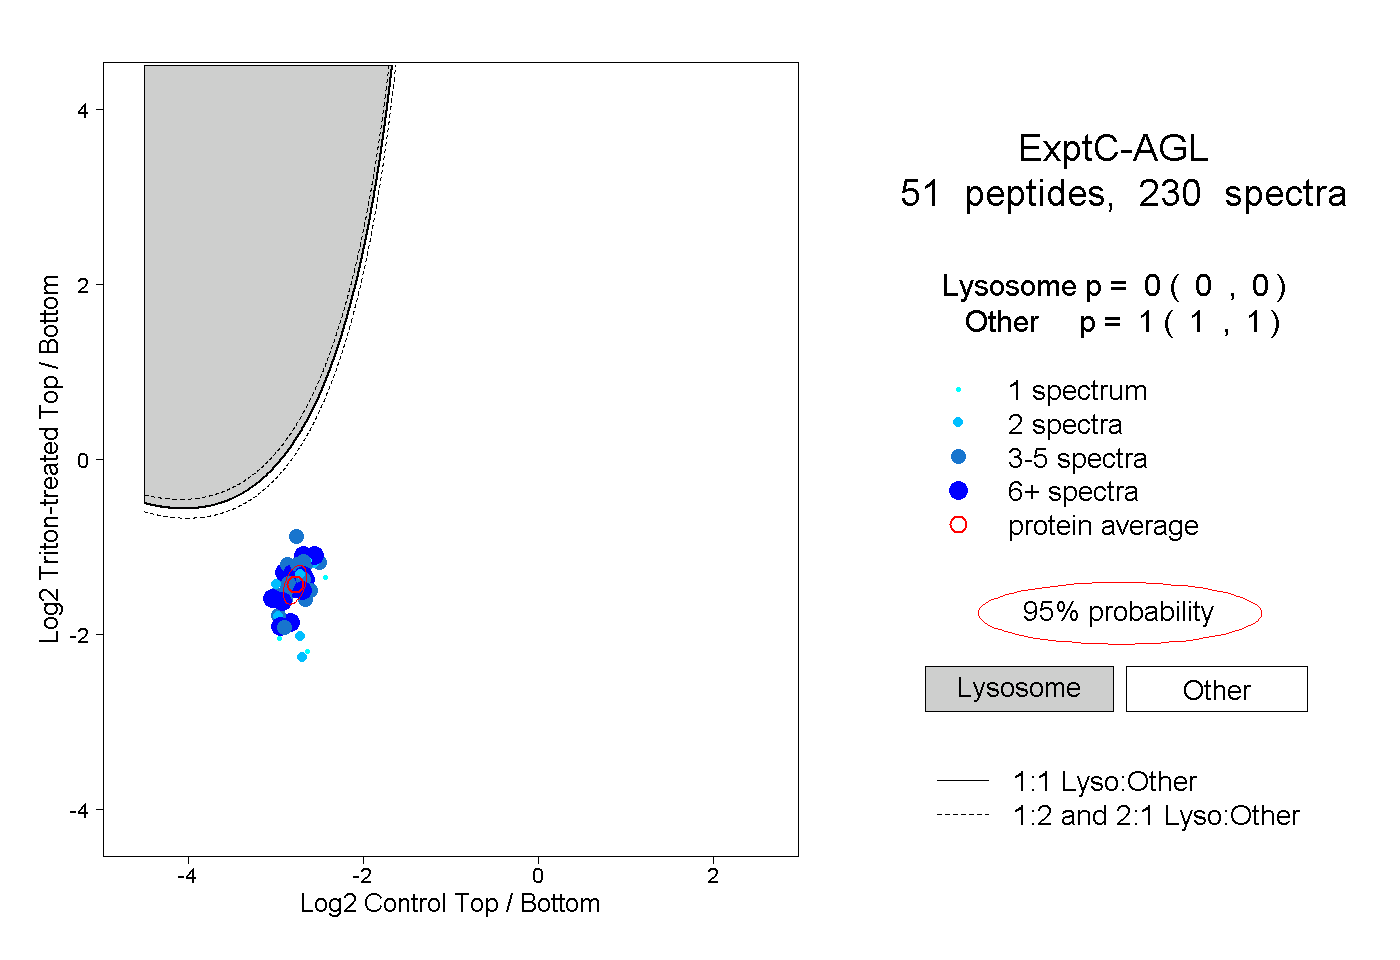
0.000 | 0.000
1.000 | 1.000
31peptides
spectra
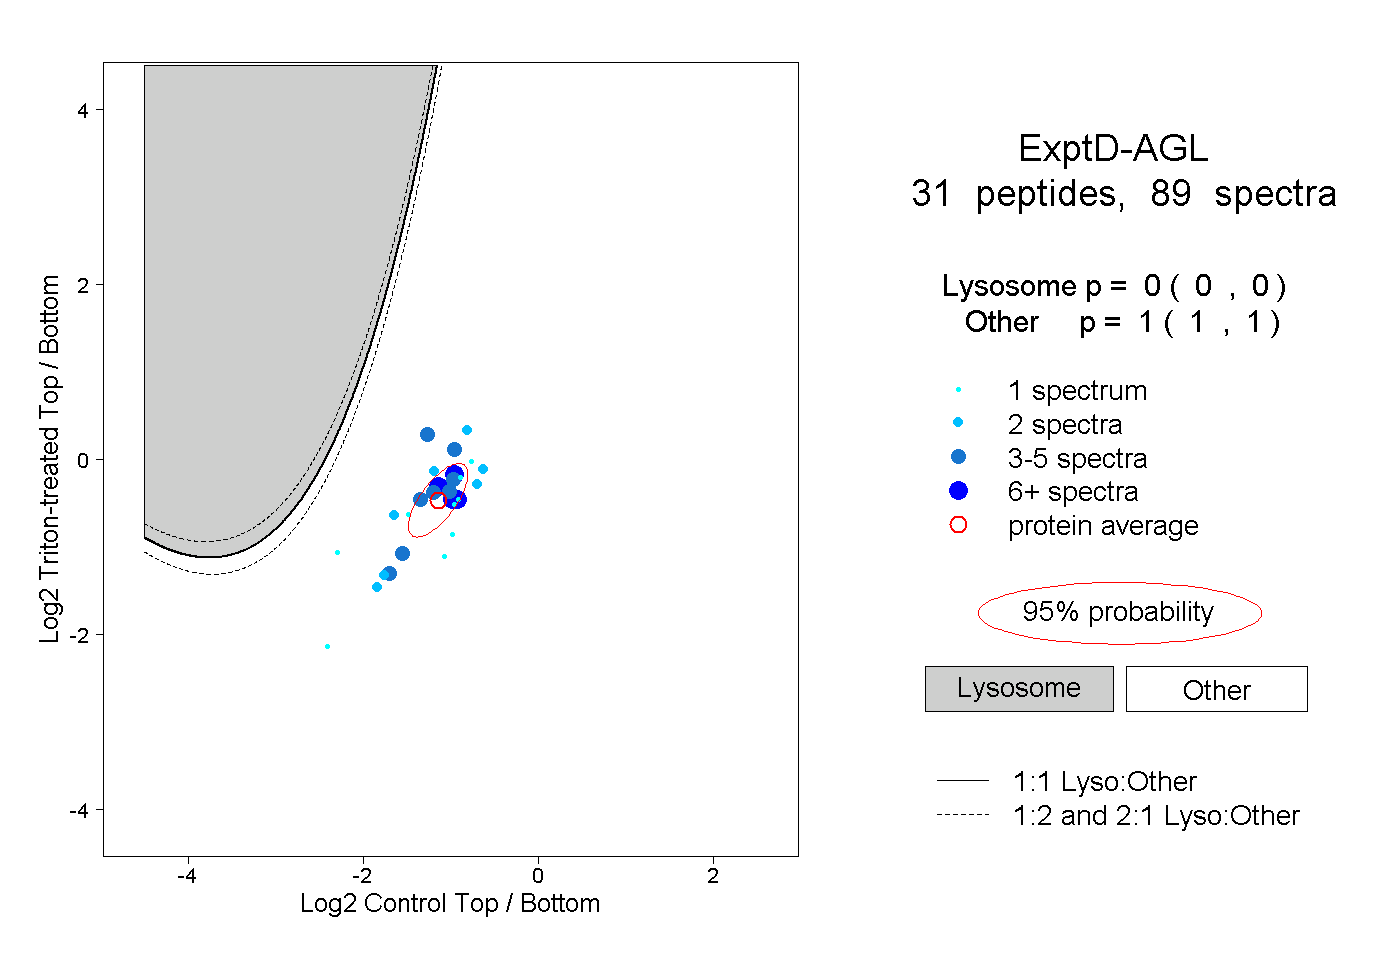
0.000 | 0.000
1.000 | 1.000