 18
18peptides
spectra
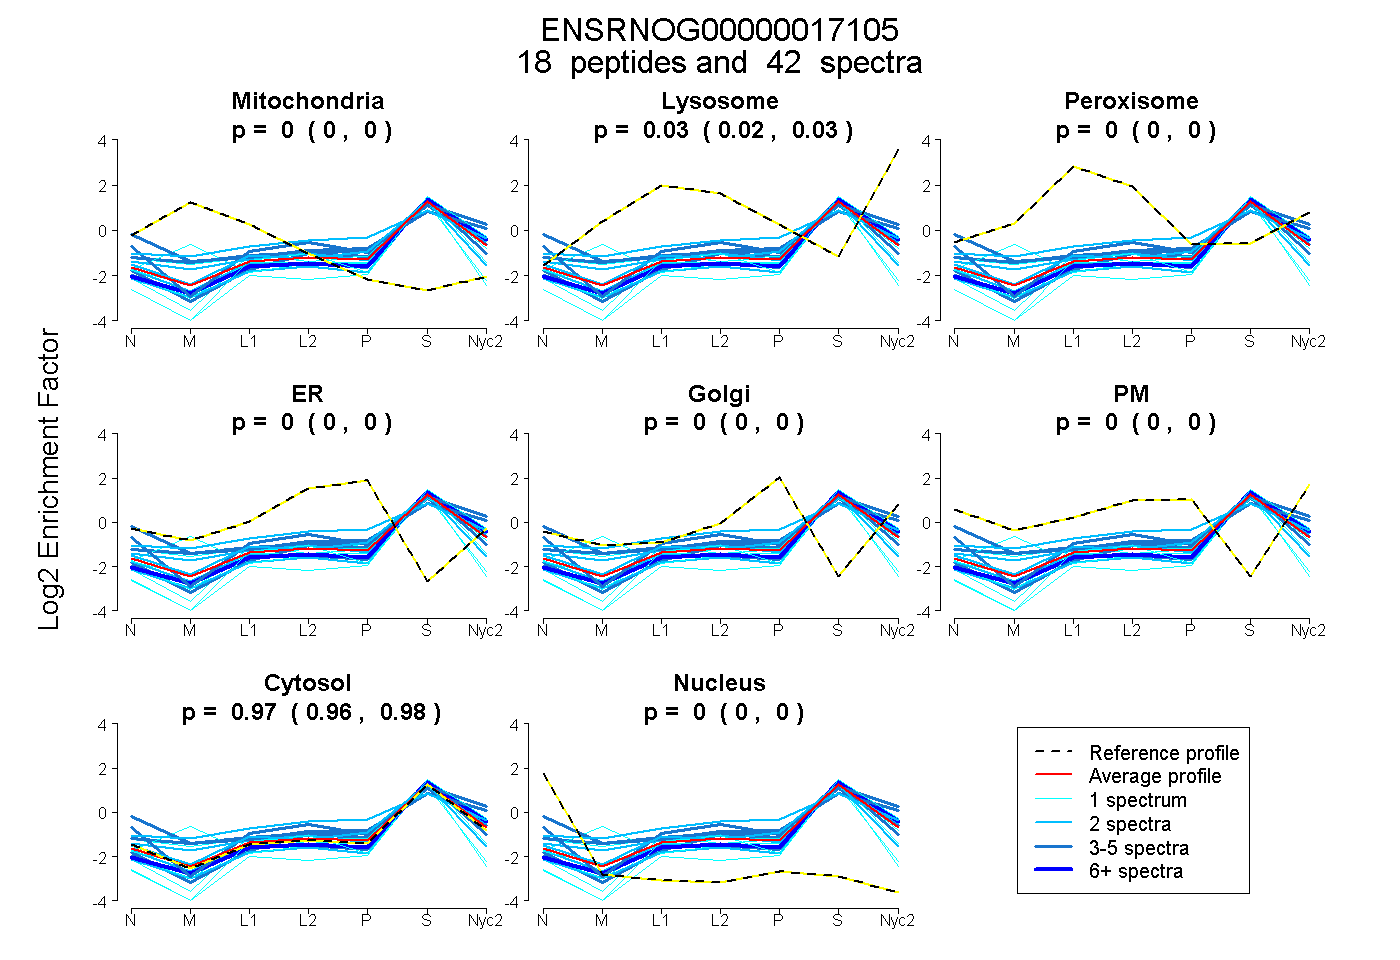
0.000 | 0.000
0.024 | 0.034
0.000 | 0.000
0.000 | 0.000
0.000 | 0.000
0.000 | 0.000
0.965 | 0.975
0.000 | 0.000
7peptides
spectra
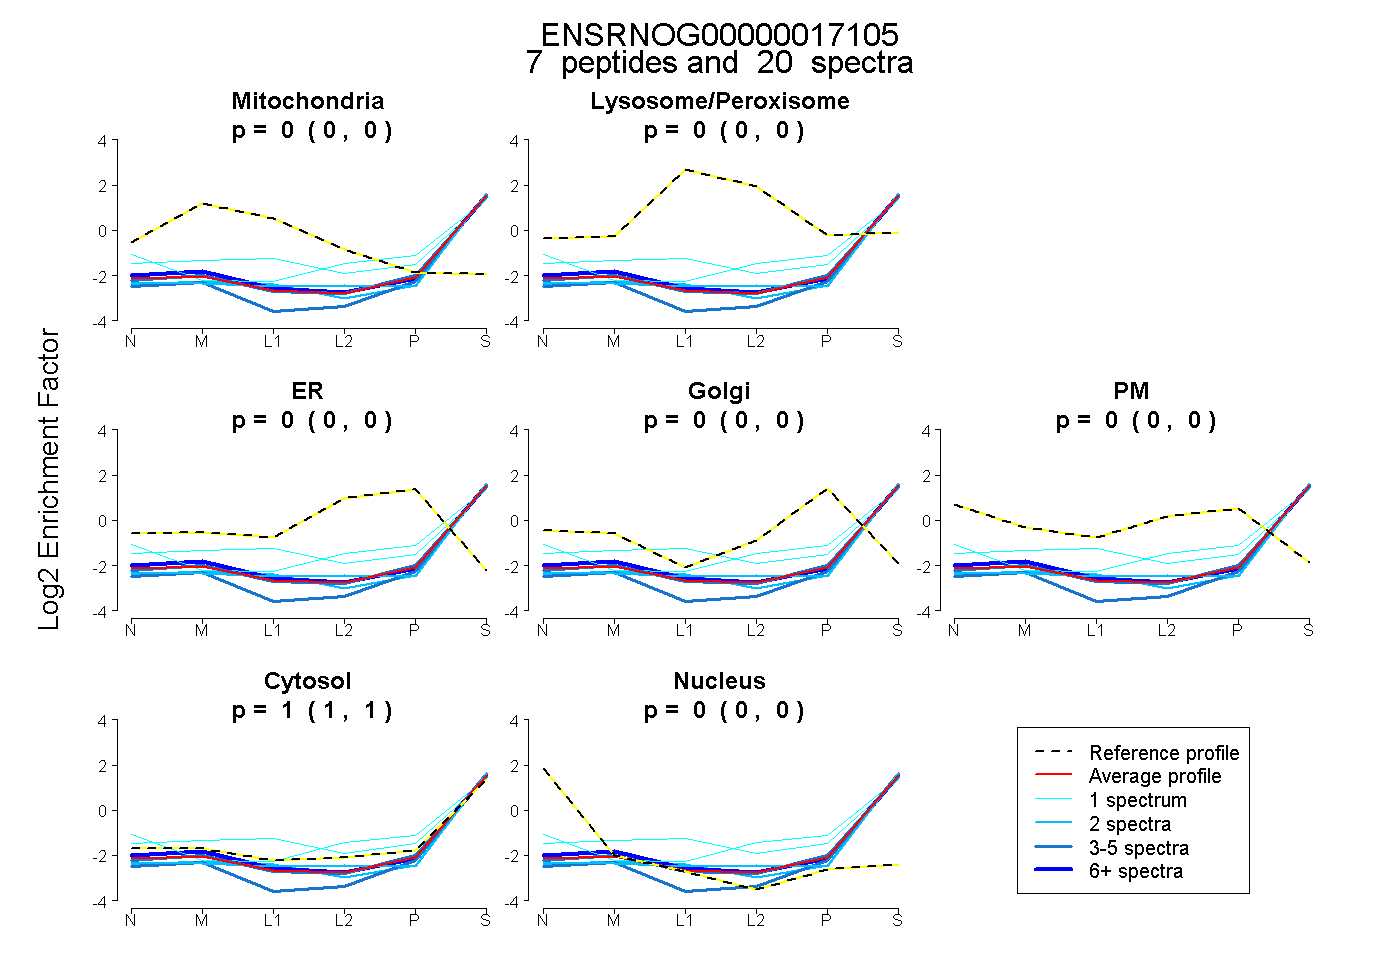
0.000 | 0.000
0.000 | 0.000
0.000 | 0.000
0.000 | 0.000
0.000 | 0.000
1.000 | 1.000
0.000 | 0.000
19peptides
spectra
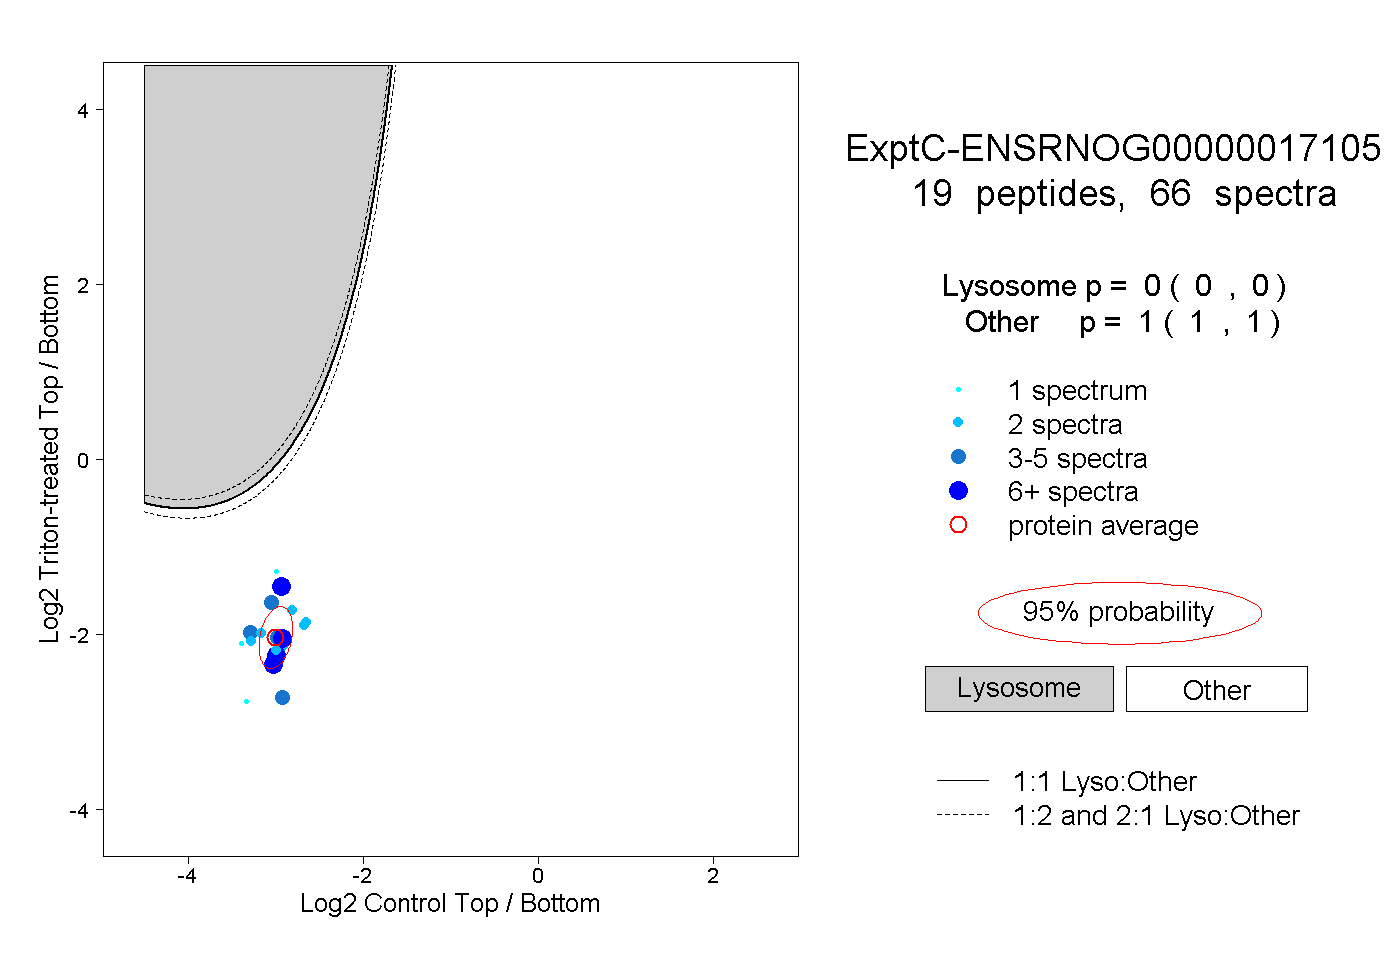
0.000 | 0.000
1.000 | 1.000
3peptides
spectra
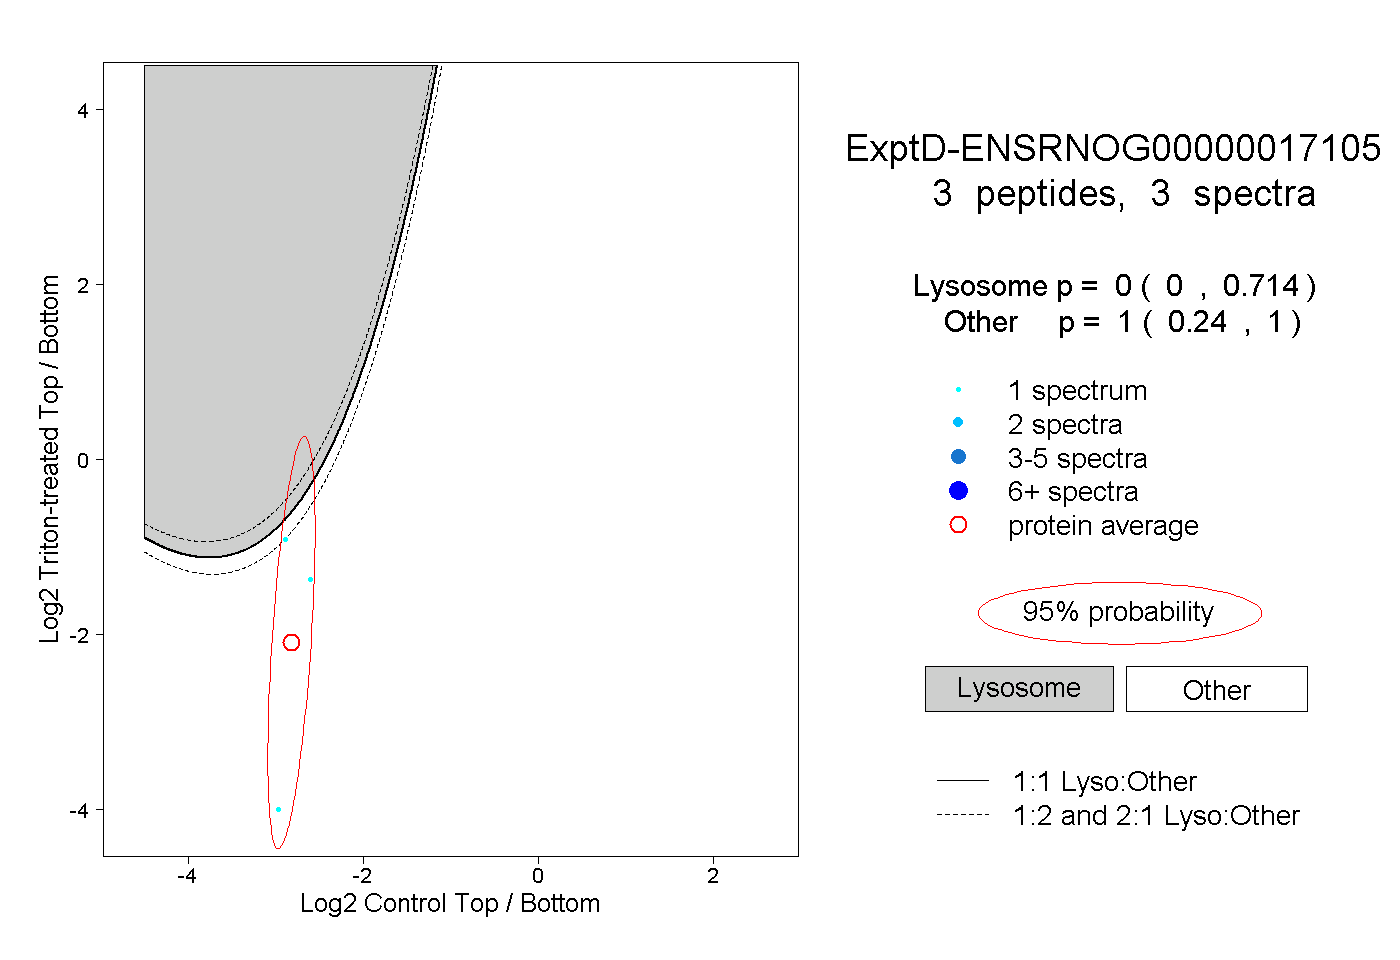
0.000 | 0.714
0.240 | 1.000