 2
2peptides
spectra
0.000 | 0.050
0.000 | 0.000
0.000 | 0.630
0.000 | 0.246
0.000 | 0.359
0.000 | 0.573
0.000 | 0.257
0.037 | 0.189
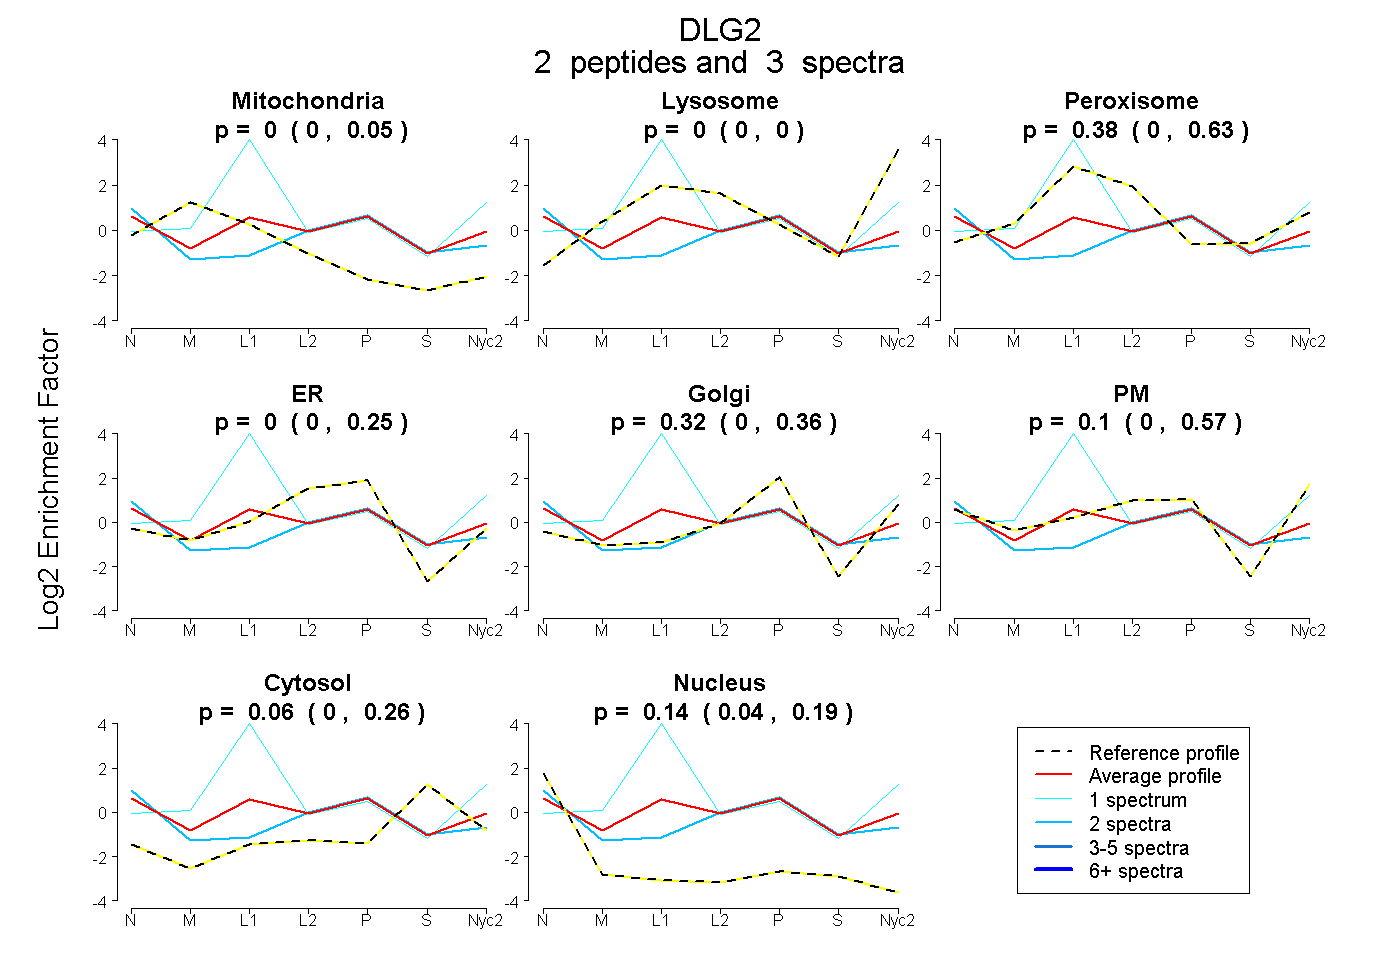
| Plot | Mito | Lyso | Perox | ER | Golgi | PM | Cytosol | Nucleus | |||||
| Expt A |
2 peptides |
3 spectra |
|
0.000 0.000 | 0.050 |
0.000 0.000 | 0.000 |
0.380 0.000 | 0.630 |
0.000 0.000 | 0.246 |
0.322 0.000 | 0.359 |
0.098 0.000 | 0.573 |
0.055 0.000 | 0.257 |
0.145 0.037 | 0.189 |
| 2 spectra, SFIFSR | 0.000 | 0.000 | 0.000 | 0.309 | 0.000 | 0.278 | 0.233 | 0.179 | ||
| 1 spectrum, YSPIPK | 0.000 | 0.080 | 0.806 | 0.000 | 0.114 | 0.000 | 0.000 | 0.000 |