 12
12peptides
spectra
0.000 | 0.000
0.086 | 0.108
0.000 | 0.000
0.035 | 0.084
0.053 | 0.094
0.000 | 0.000
0.759 | 0.771
0.000 | 0.000
2peptides
spectra
NA | NA
NA | NA
NA | NA
NA | NA
NA | NA
NA | NA
NA | NA
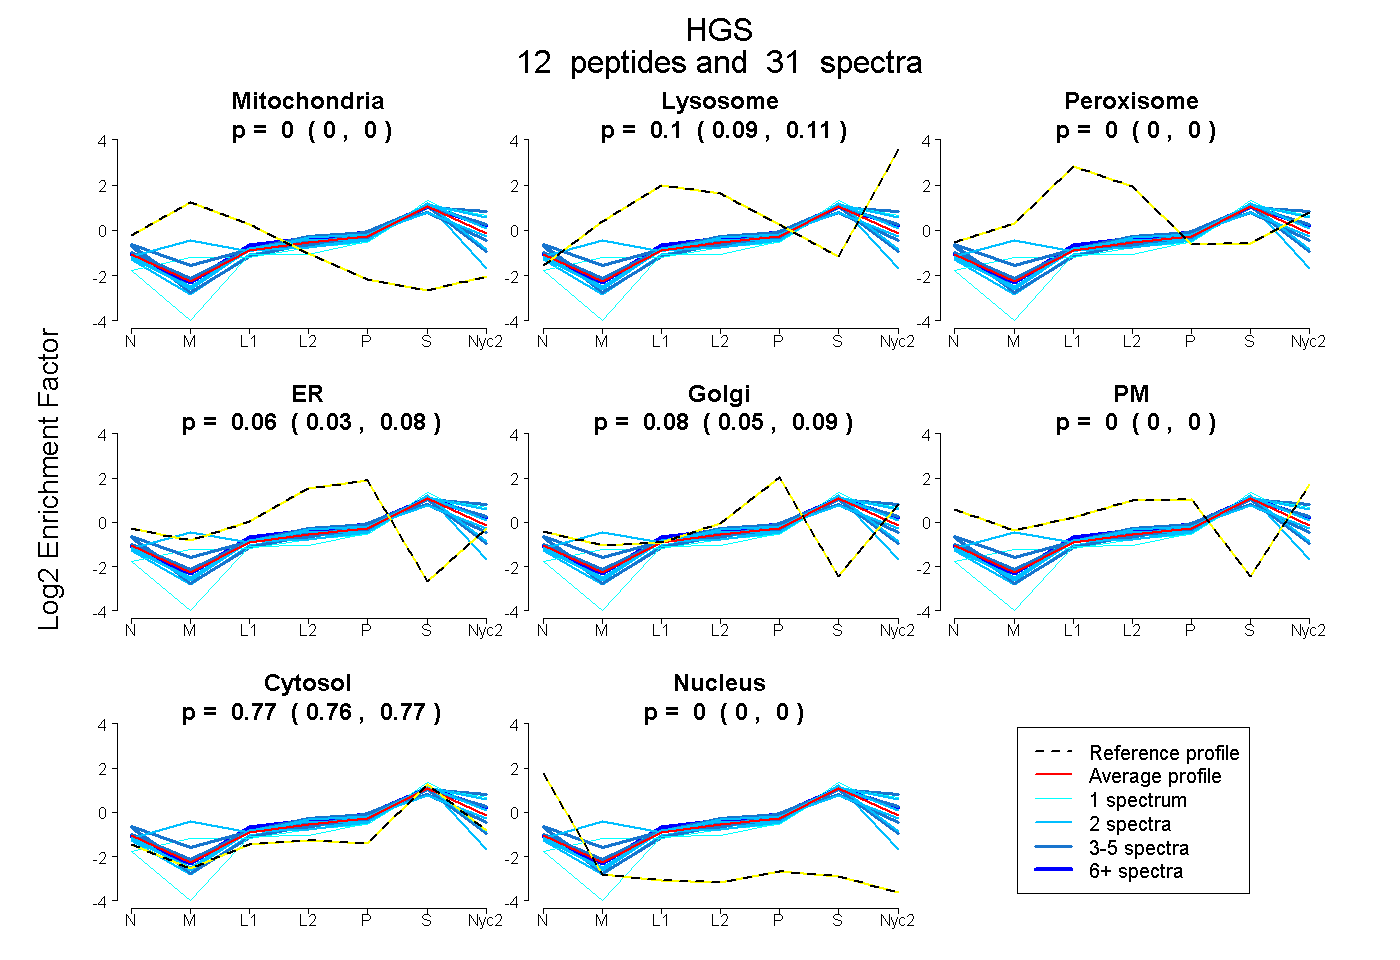
| Plot | Mito | Lyso | Perox | ER | Golgi | PM | Cytosol | Nucleus | |||||
| Expt A |
12 peptides |
31 spectra |
|
0.000 0.000 | 0.000 |
0.098 0.086 | 0.108 |
0.000 0.000 | 0.000 |
0.061 0.035 | 0.084 |
0.075 0.053 | 0.094 |
0.000 0.000 | 0.000 |
0.765 0.759 | 0.771 |
0.000 0.000 | 0.000 |
||
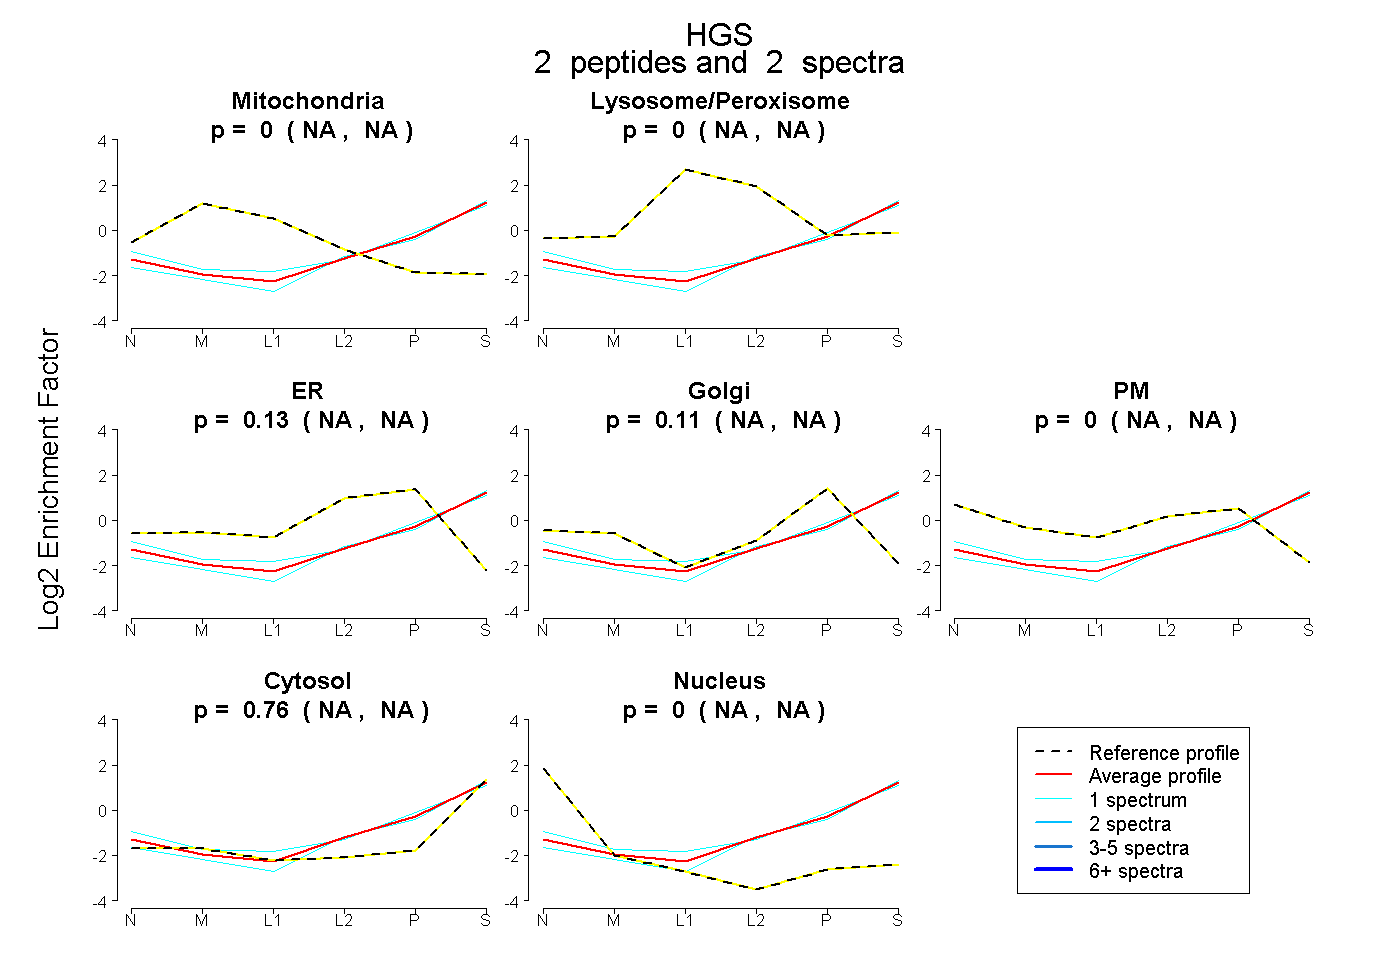
| Plot | Mito | Lyso or Perox | ER | Golgi | PM | Cytosol | Nucleus | ||||||
| Expt B |
2 peptides |
2 spectra |
|
0.000 NA | NA |
0.000 NA | NA |
0.132 NA | NA |
0.111 NA | NA |
0.000 NA | NA |
0.756 NA | NA |
0.000 NA | NA |
| 1 spectrum, AAEEAER | 0.000 | 0.091 | 0.000 | 0.255 | 0.000 | 0.653 | 0.000 | |||
| 1 spectrum, ESDAMFAAER | 0.000 | 0.000 | 0.080 | 0.108 | 0.000 | 0.812 | 0.000 |
| Plot | Lyso | Other | |||||||||||
| Expt C |
15 peptides |
51 spectra |
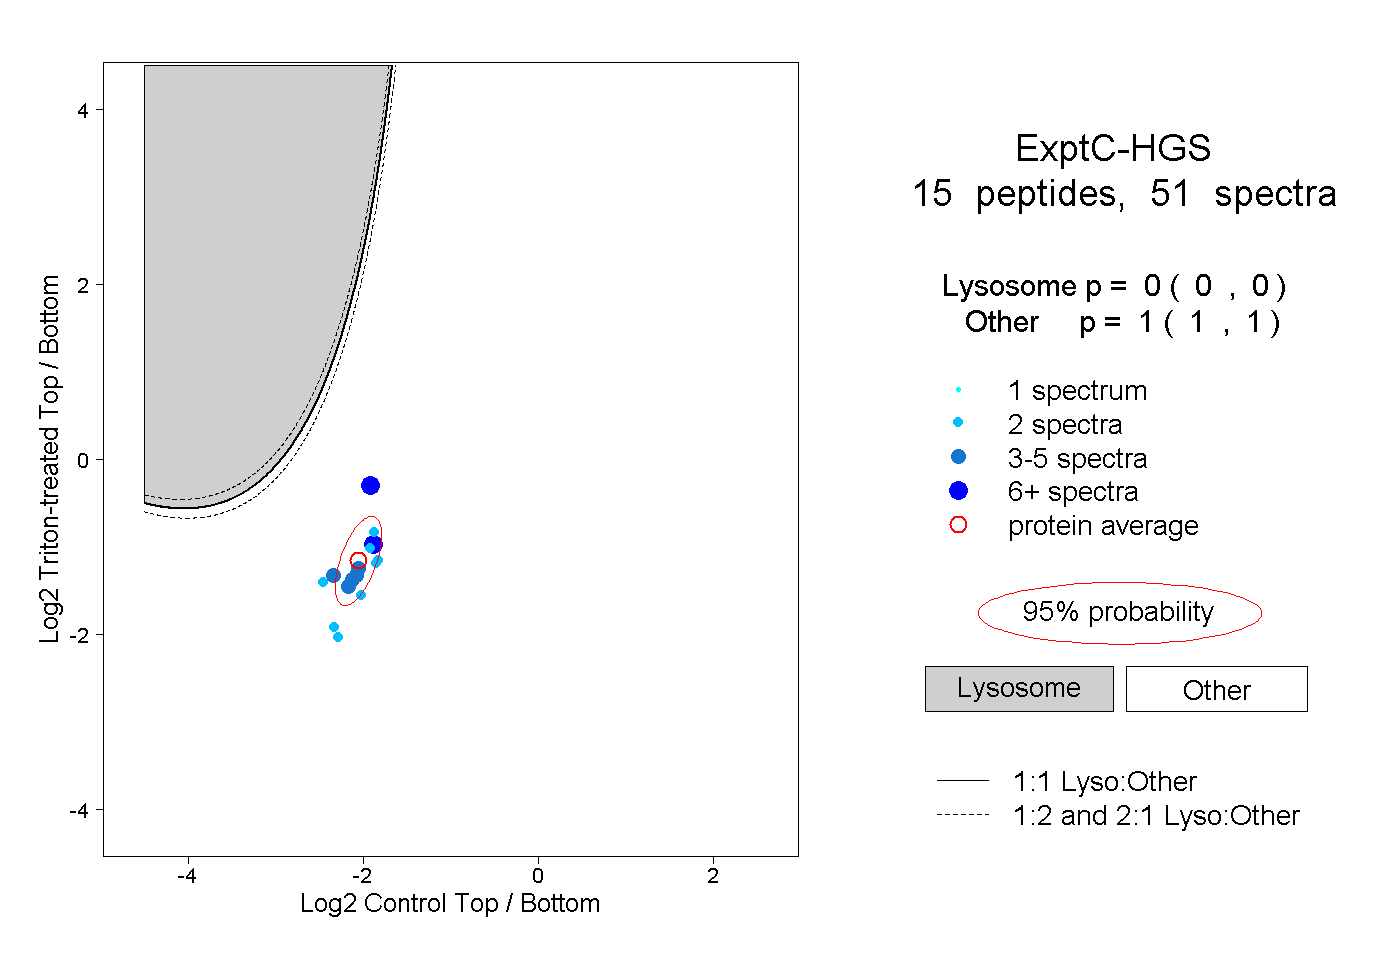 |
0.000 0.000 | 0.000 |
1.000 1.000 | 1.000 |
||||||||
| Plot | Lyso | Other | |||||||||||
| Expt D |
1 peptide |
2 spectra |
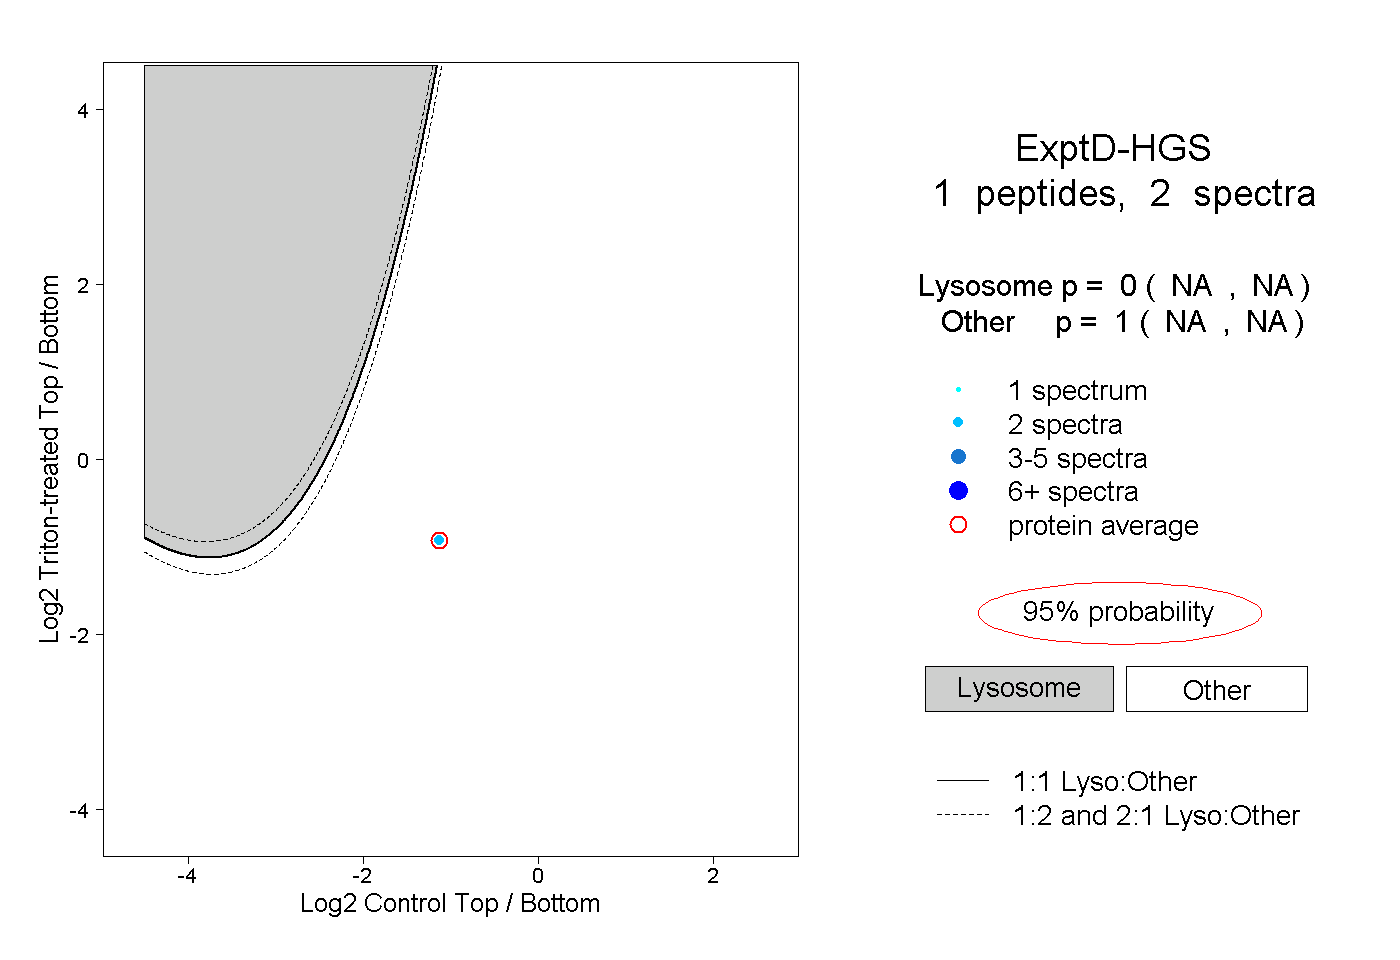 |
0.000 NA | NA |
1.000 NA | NA |