7
7peptides
spectra
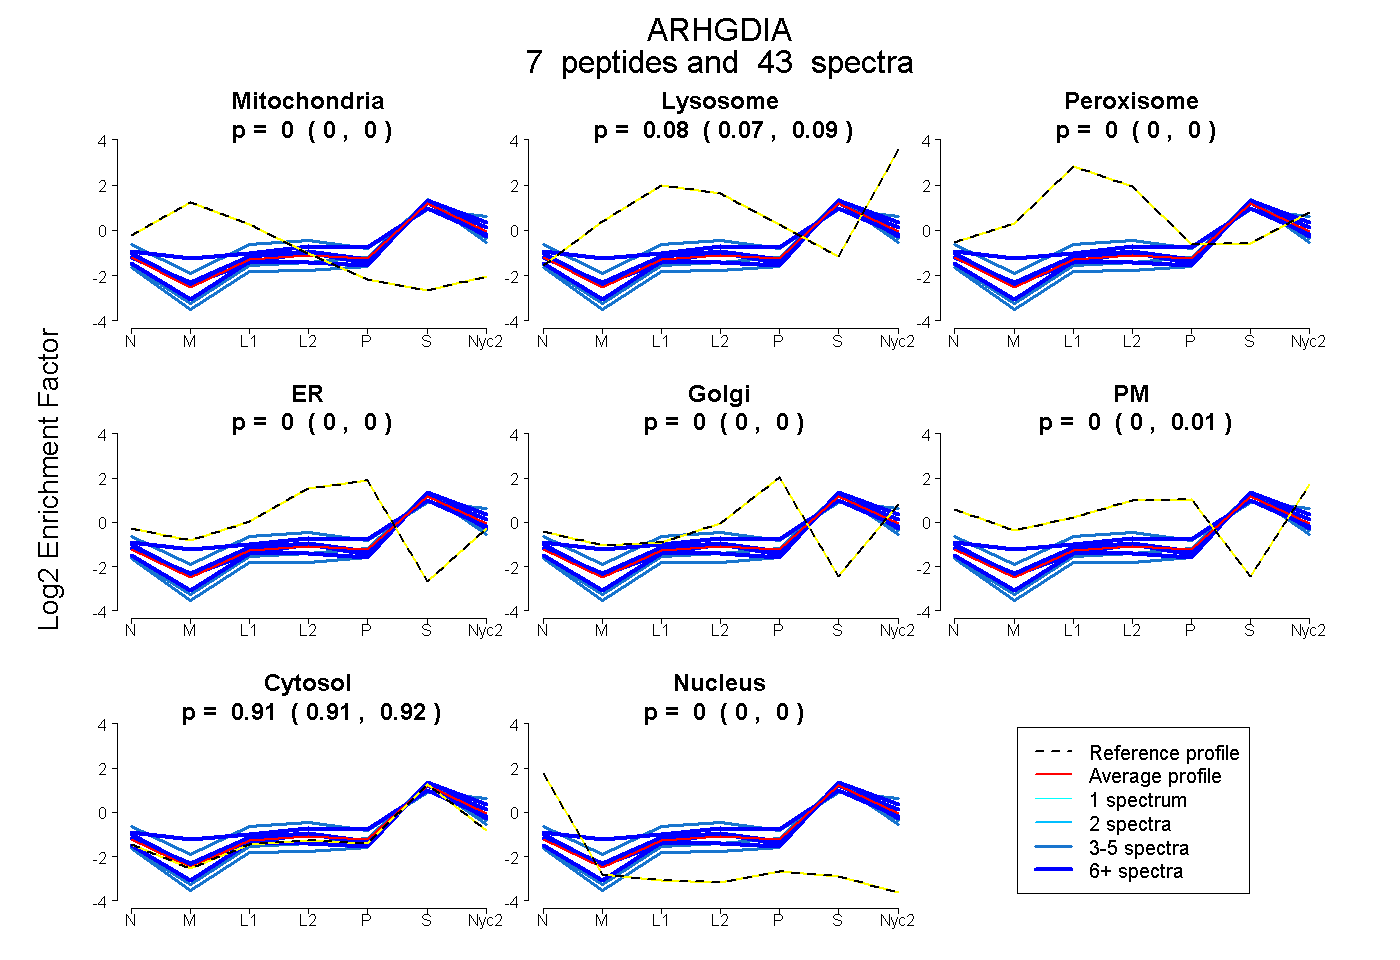
0.000 | 0.000
0.071 | 0.091
0.000 | 0.000
0.000 | 0.000
0.000 | 0.000
0.000 | 0.014
0.905 | 0.918
0.000 | 0.000
4peptides
spectra
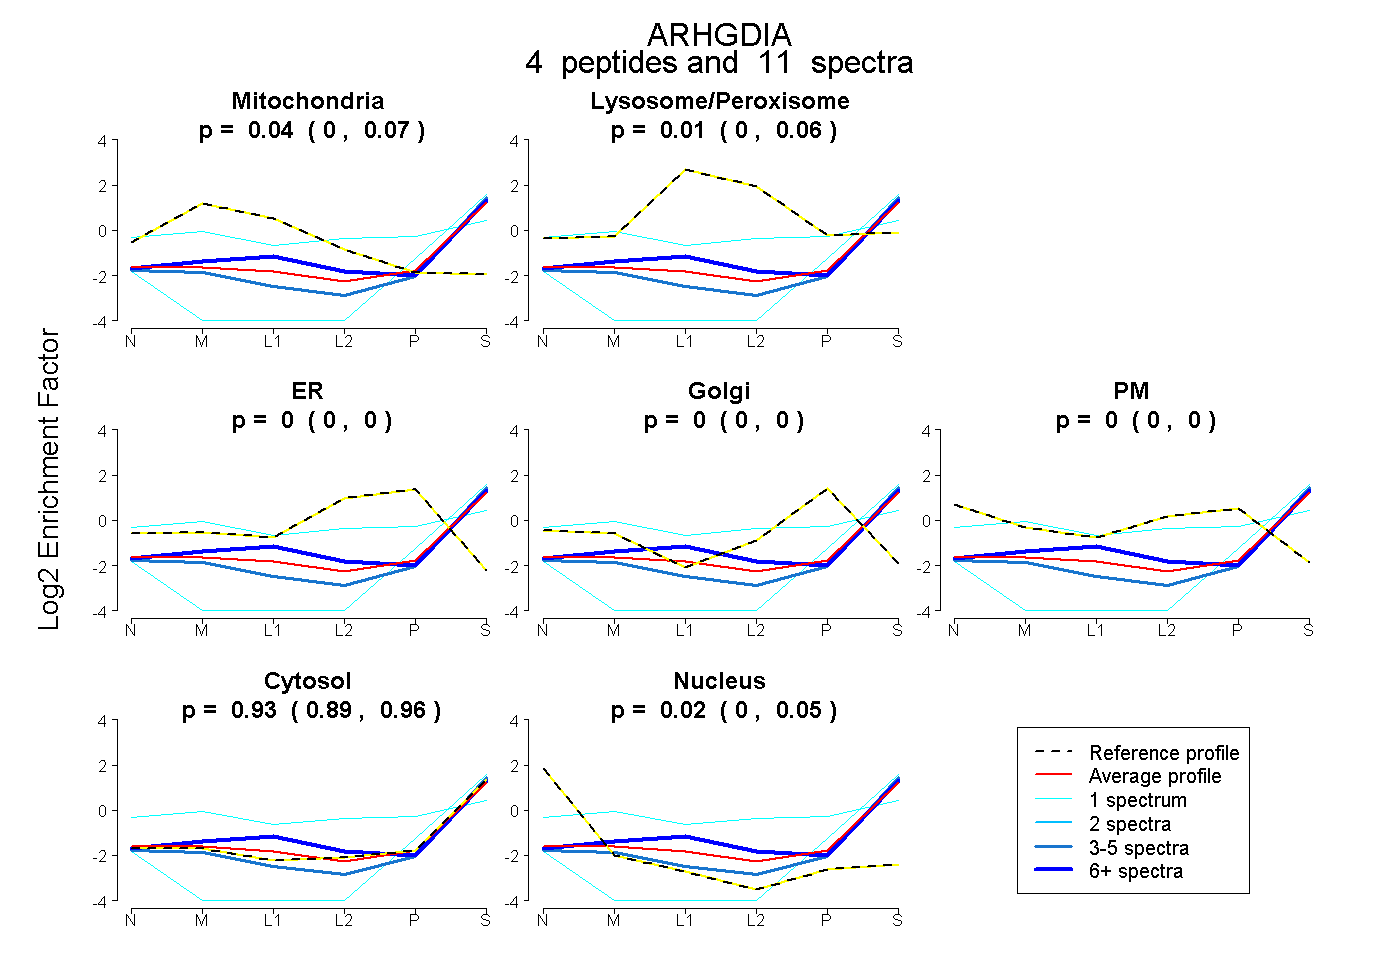
0.000 | 0.073
0.000 | 0.063
0.000 | 0.000
0.000 | 0.003
0.000 | 0.000
0.893 | 0.964
0.000 | 0.048