 5
5peptides
spectra
0.000 | 0.000
0.000 | 0.000
0.000 | 0.000
0.317 | 0.465
0.009 | 0.178
0.000 | 0.000
0.372 | 0.411
0.082 | 0.122
| Plot | Mito | Lyso | Perox | ER | Golgi | PM | Cytosol | Nucleus | |||||
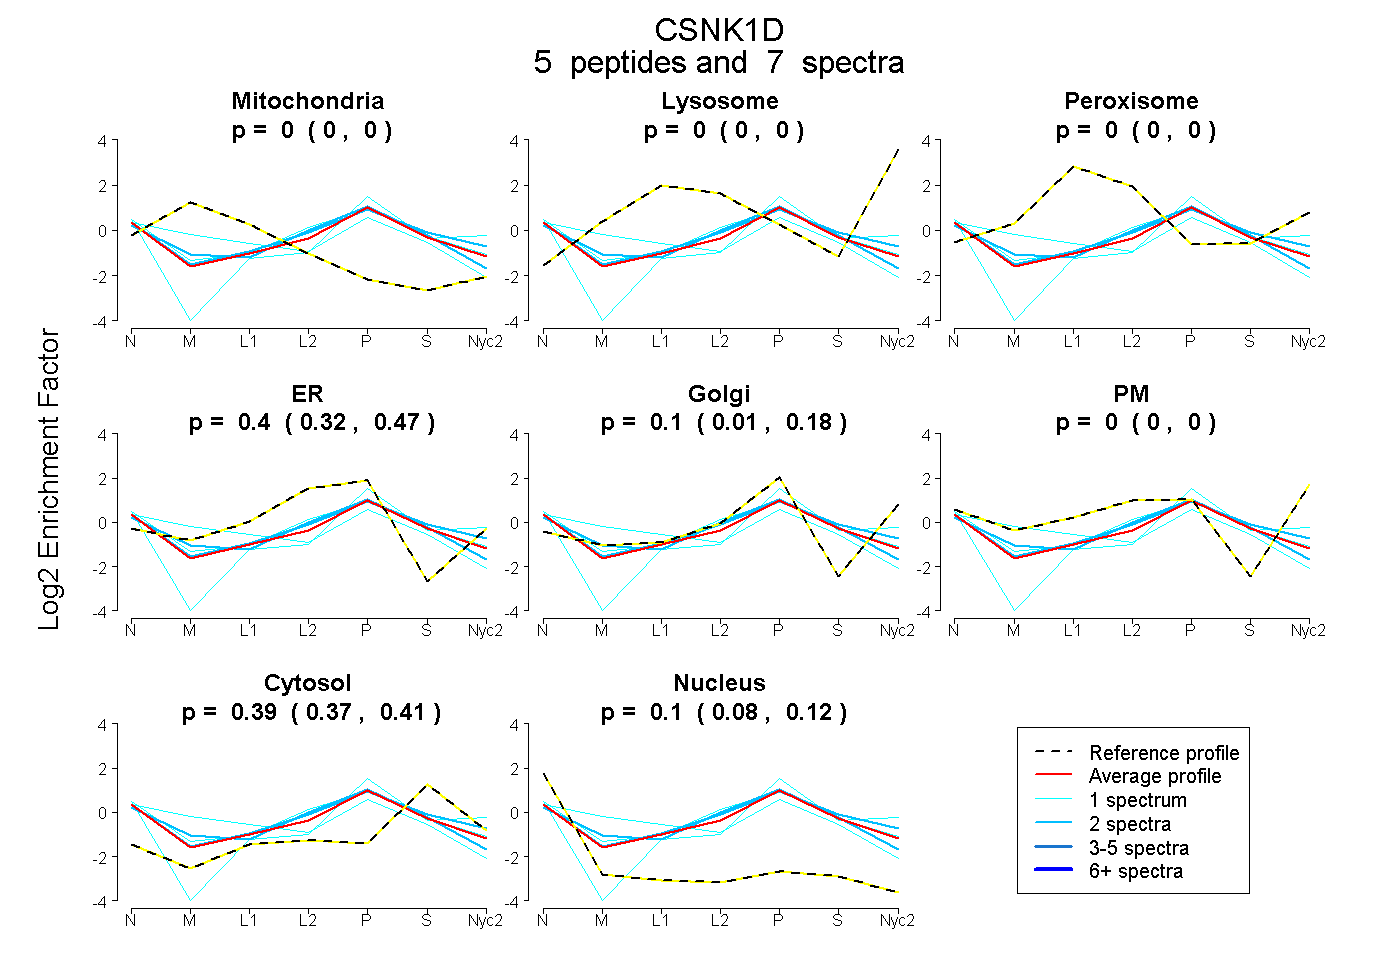
| Expt A |
5 peptides |
7 spectra |
|
0.000 0.000 | 0.000 |
0.000 0.000 | 0.000 |
0.000 0.000 | 0.000 |
0.401 0.317 | 0.465 |
0.103 0.009 | 0.178 |
0.000 0.000 | 0.000 |
0.393 0.372 | 0.411 |
0.103 0.082 | 0.122 |
| 2 spectra, IEYIHSK | 0.000 | 0.000 | 0.000 | 0.378 | 0.099 | 0.045 | 0.438 | 0.039 | ||
| 1 spectrum, GAPVNVSSSDLTGR | 0.000 | 0.000 | 0.000 | 0.000 | 0.502 | 0.000 | 0.406 | 0.093 | ||
| 1 spectrum, FDDKPDYSYLR | 0.000 | 0.000 | 0.000 | 0.536 | 0.000 | 0.000 | 0.383 | 0.080 | ||
| 2 spectra, MSTPIEVLCK | 0.000 | 0.000 | 0.000 | 0.516 | 0.000 | 0.000 | 0.378 | 0.105 | ||
| 1 spectrum, GLPSTASGR | 0.263 | 0.000 | 0.000 | 0.355 | 0.000 | 0.000 | 0.288 | 0.094 |
| Plot | Mito | Lyso or Perox | ER | Golgi | PM | Cytosol | Nucleus | ||||||
| Expt B |
2 peptides |
3 spectra |
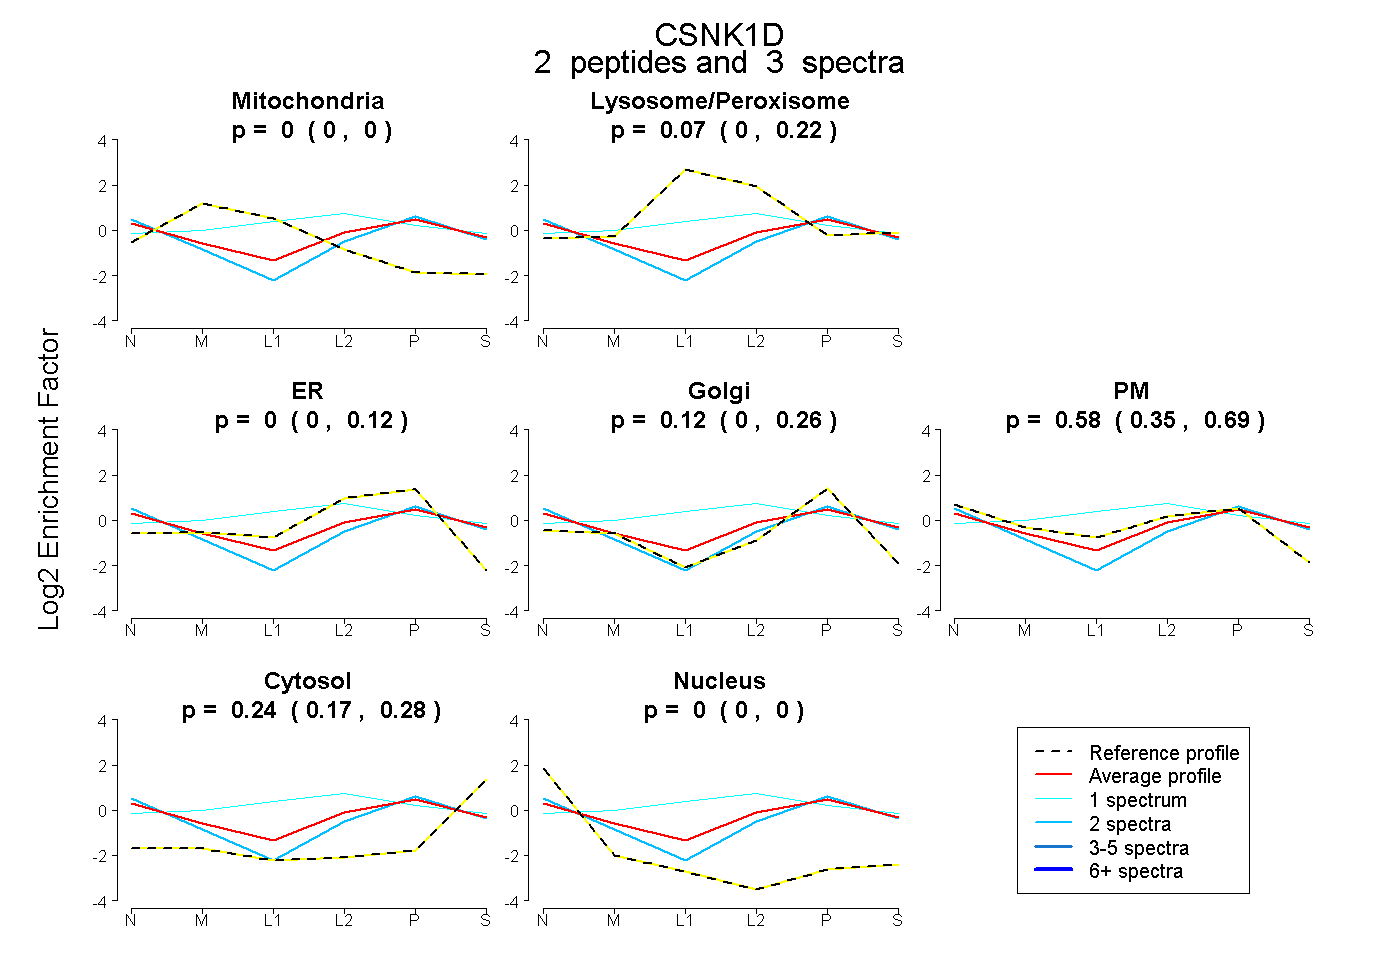 |
0.000 0.000 | 0.000 |
0.068 0.000 | 0.222 |
0.000 0.000 | 0.122 |
0.116 0.000 | 0.262 |
0.580 0.348 | 0.689 |
0.237 0.166 | 0.282 |
0.000 0.000 | 0.000 |
|||
| Plot | Lyso | Other | |||||||||||
| Expt C |
3 peptides |
11 spectra |
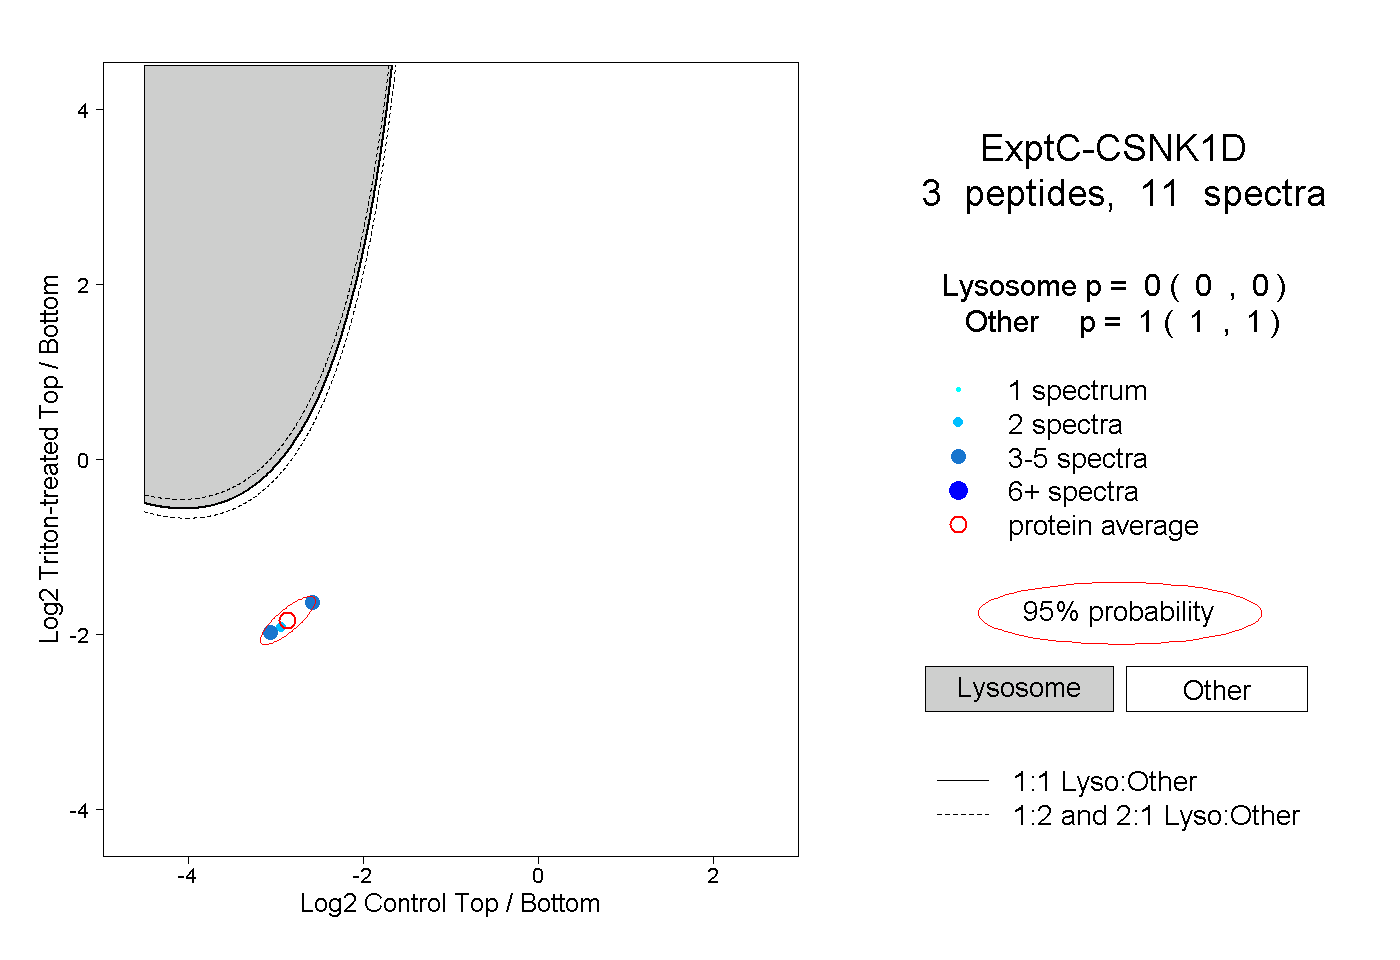 |
0.000 0.000 | 0.000 |
1.000 1.000 | 1.000 |
||||||||
| Plot | Lyso | Other | |||||||||||
| Expt D |
1 peptide |
1 spectrum |
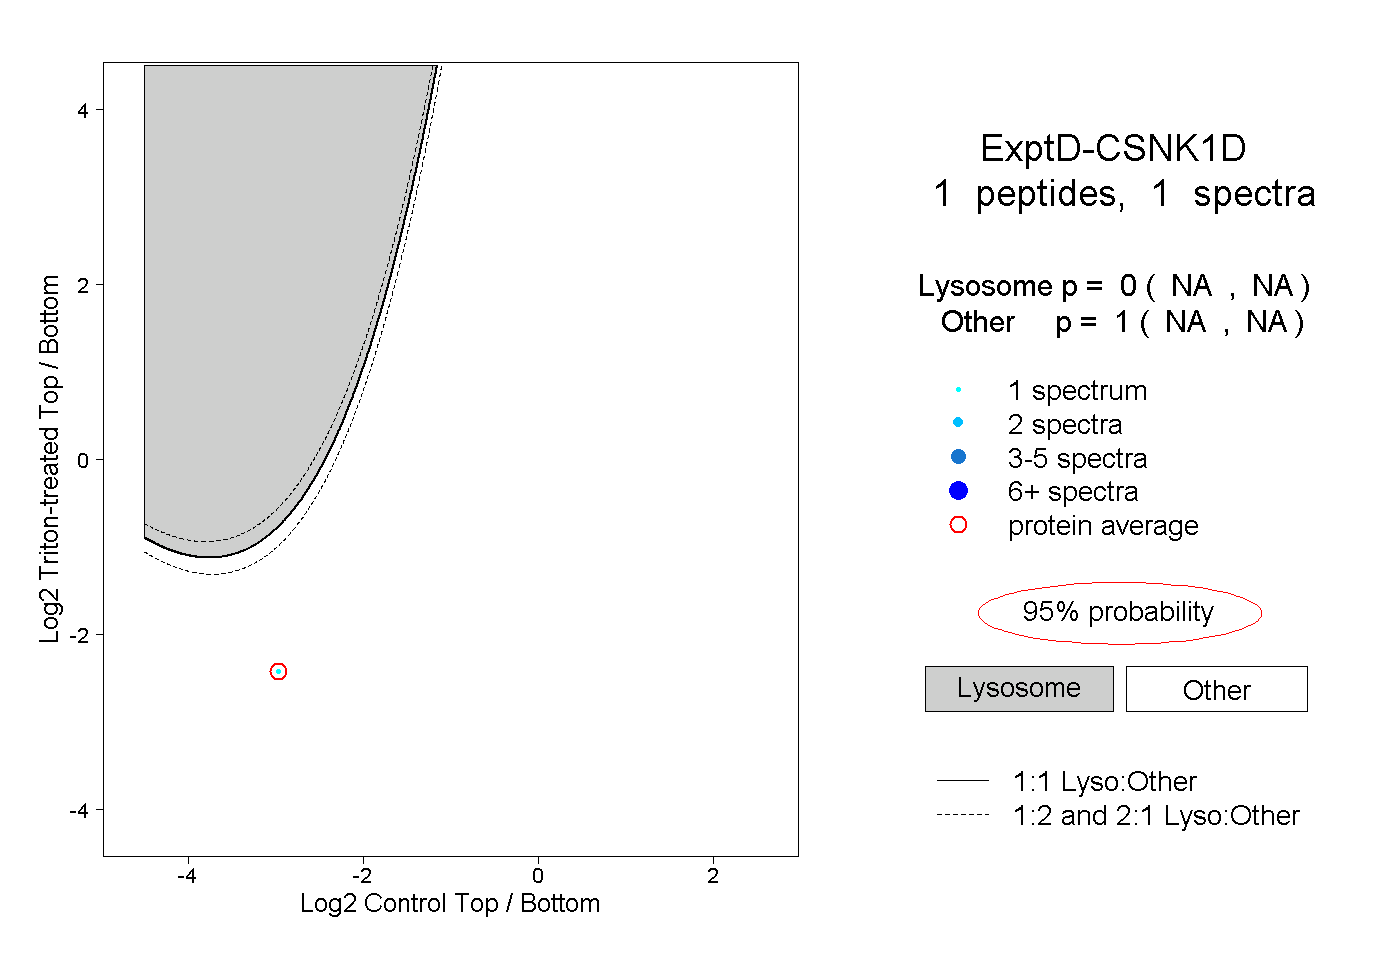 |
0.000 NA | NA |
1.000 NA | NA |