 3
3peptides
spectra
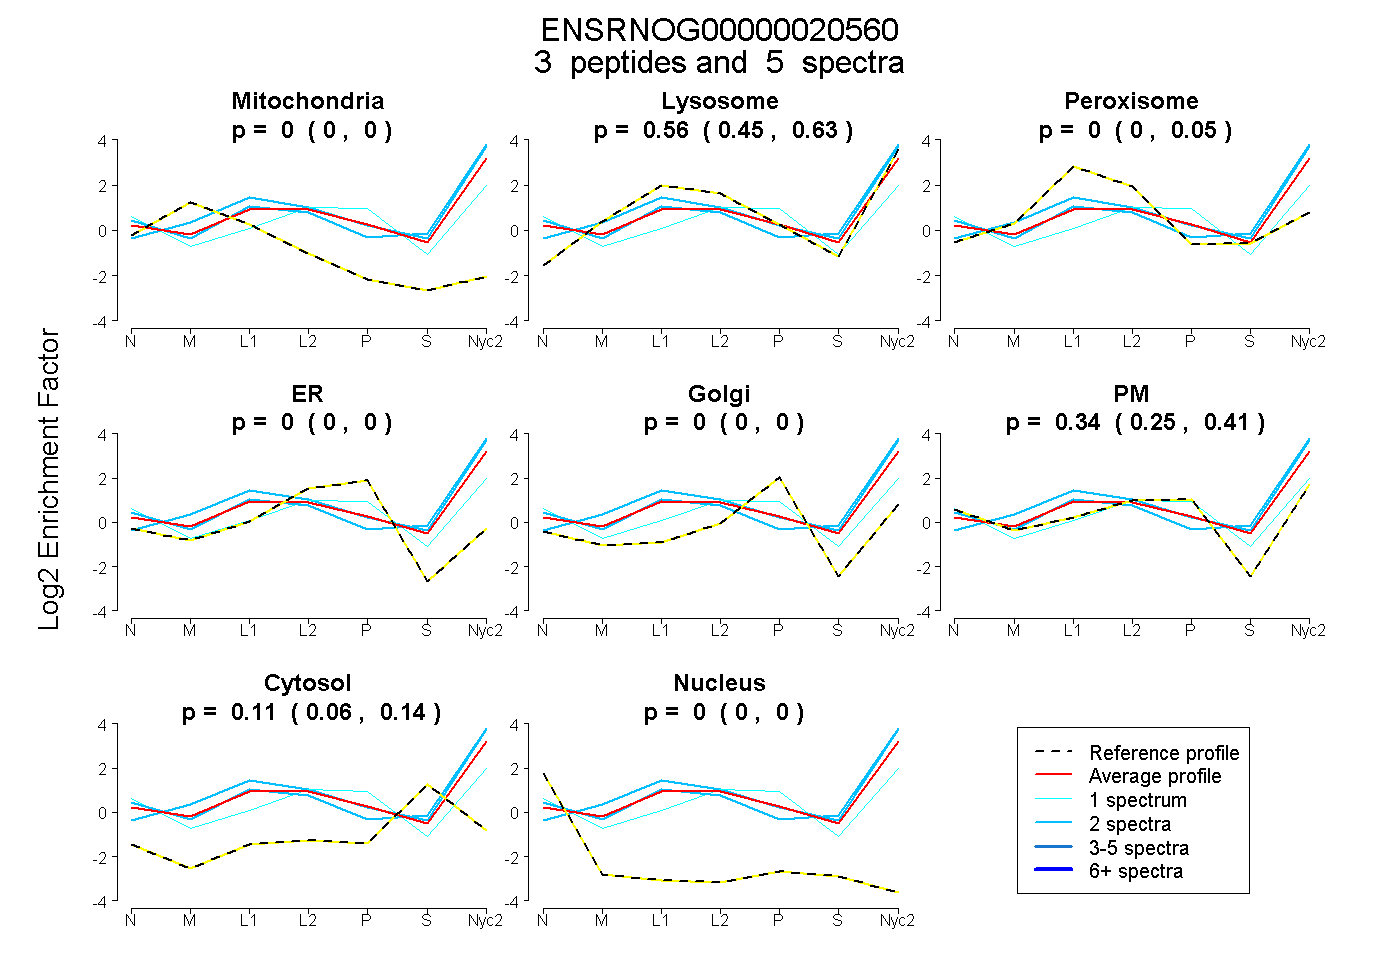
0.000 | 0.000
0.451 | 0.632
0.000 | 0.048
0.000 | 0.000
0.000 | 0.000
0.251 | 0.407
0.061 | 0.144
0.000 | 0.000
| Plot | Mito | Lyso | Perox | ER | Golgi | PM | Cytosol | Nucleus | |||||
| Expt A |
3 peptides |
5 spectra |
|
0.000 0.000 | 0.000 |
0.556 0.451 | 0.632 |
0.000 0.000 | 0.048 |
0.000 0.000 | 0.000 |
0.000 0.000 | 0.000 |
0.338 0.251 | 0.407 |
0.106 0.061 | 0.144 |
0.000 0.000 | 0.000 |
| 2 spectra, VEILYR | 0.000 | 0.667 | 0.000 | 0.000 | 0.000 | 0.199 | 0.134 | 0.000 | ||
| 1 spectrum, HPGWLVHNCR | 0.000 | 0.129 | 0.000 | 0.000 | 0.000 | 0.748 | 0.124 | 0.000 | ||
| 2 spectra, FITNHSVTR | 0.000 | 0.827 | 0.000 | 0.000 | 0.000 | 0.109 | 0.064 | 0.000 |
| Plot | Lyso | Other | |||||||||||
| Expt C |
2 peptides |
3 spectra |
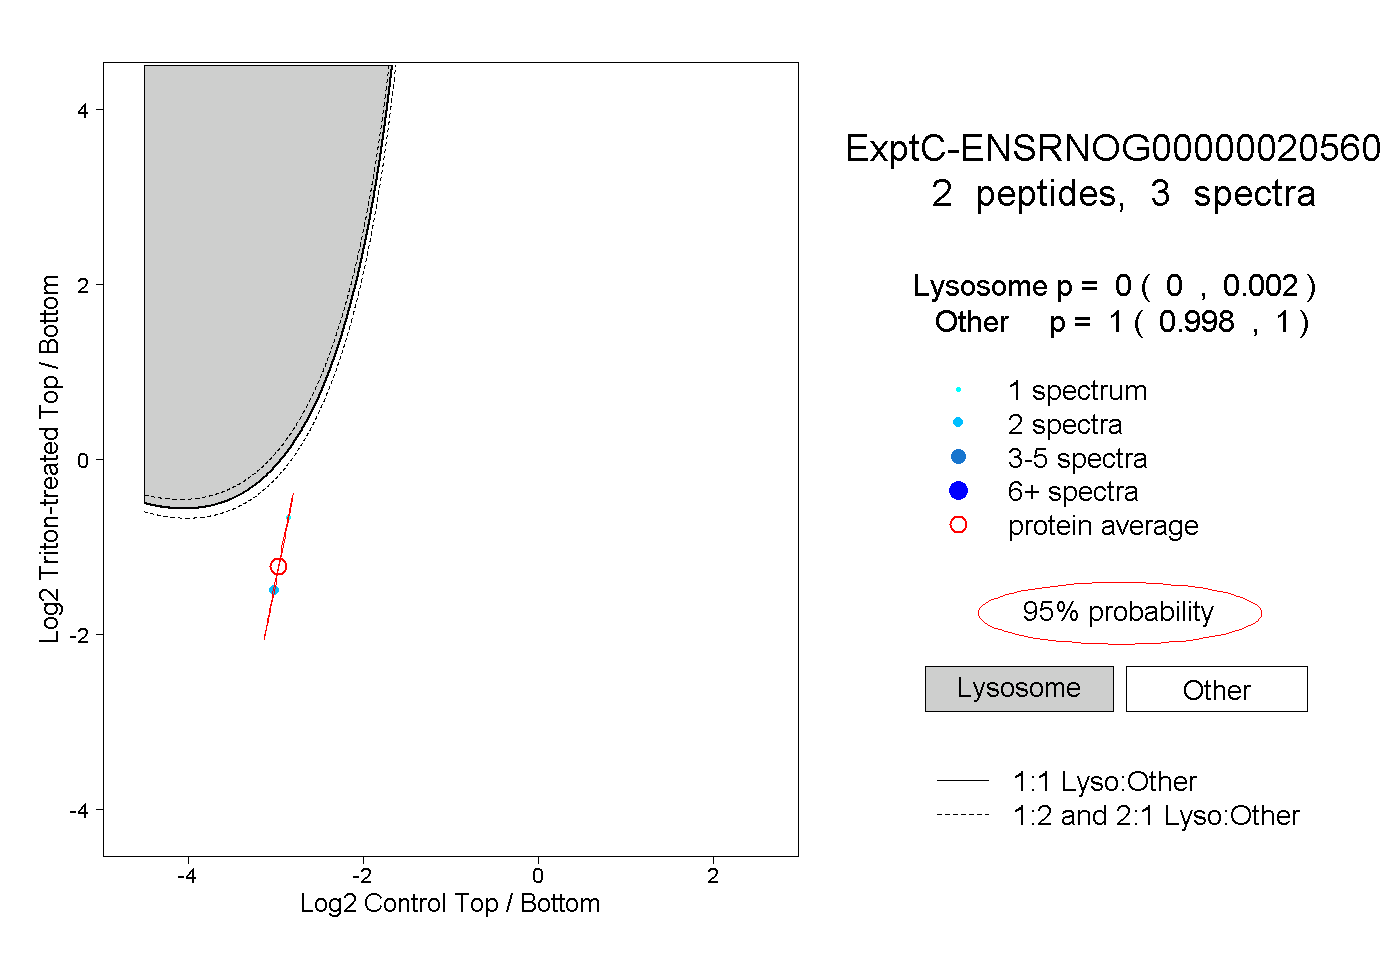 |
0.000 0.000 | 0.002 |
1.000 0.998 | 1.000 |