DOCK1
[ENSRNOP00000051781]
Main page
| | | Plot |
Mito |
Lyso |
|
Perox |
ER |
Golgi |
PM |
Cytosol |
Nucleus |
|
| Expt A |
 25
25
peptides |
46
spectra |
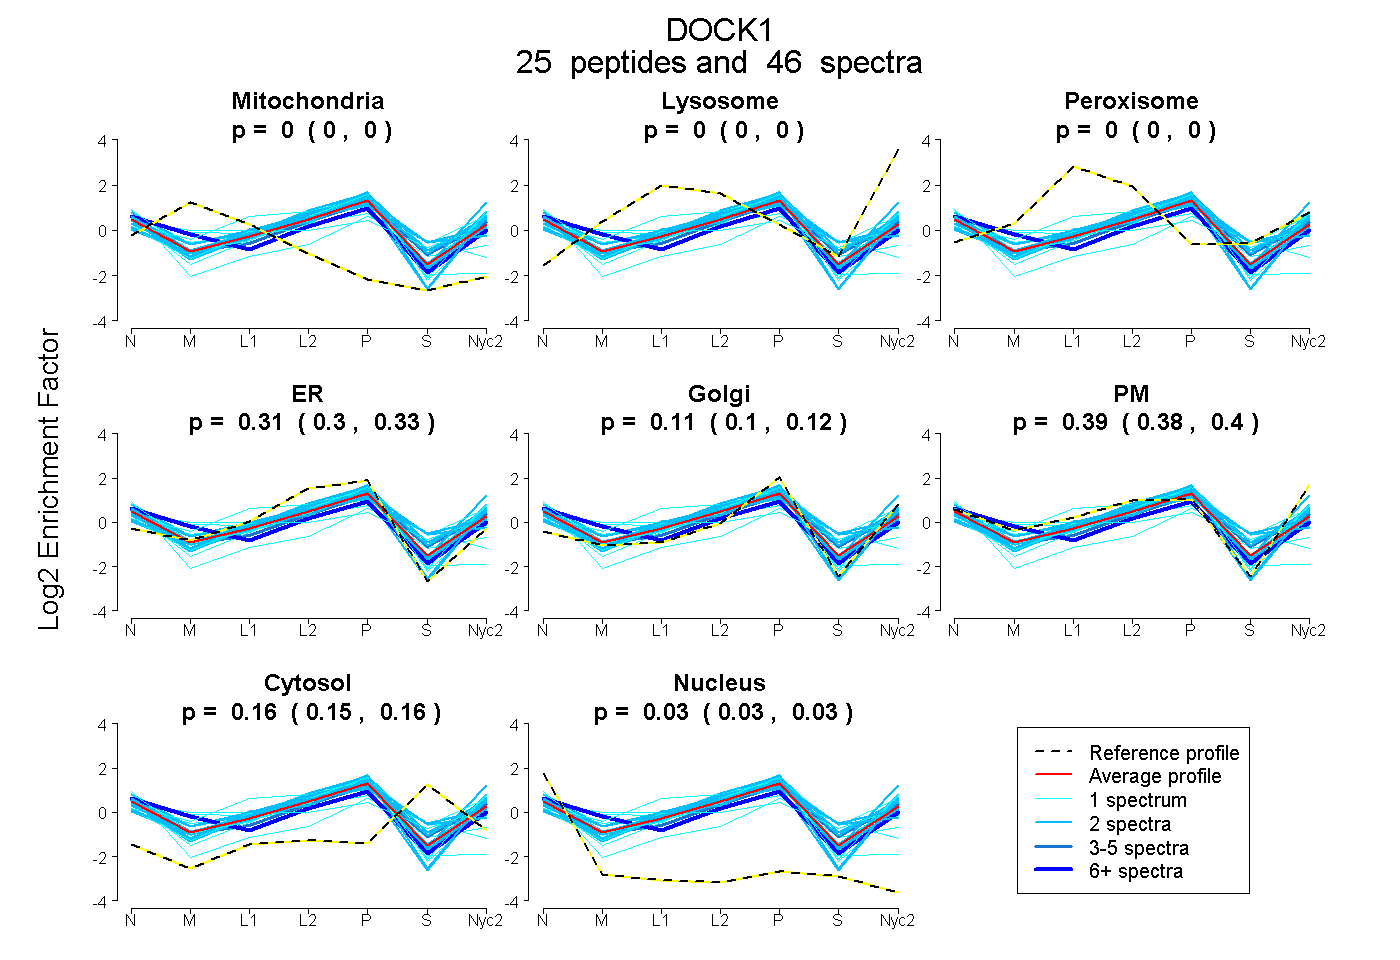 |
0.000
0.000 | 0.000 |
0.000
0.000 | 0.000 |
|
0.000
0.000 | 0.000 |
0.312
0.296 | 0.325 |
0.108
0.097 | 0.119 |
0.393
0.380 | 0.403 |
0.156
0.149 | 0.161 |
0.030
0.026 | 0.034 |
|
| | | Plot |
Mito |
|
Lyso or Perox |
|
ER |
Golgi |
PM |
Cytosol |
Nucleus |
|
| Expt B |
5
peptides |
6
spectra |
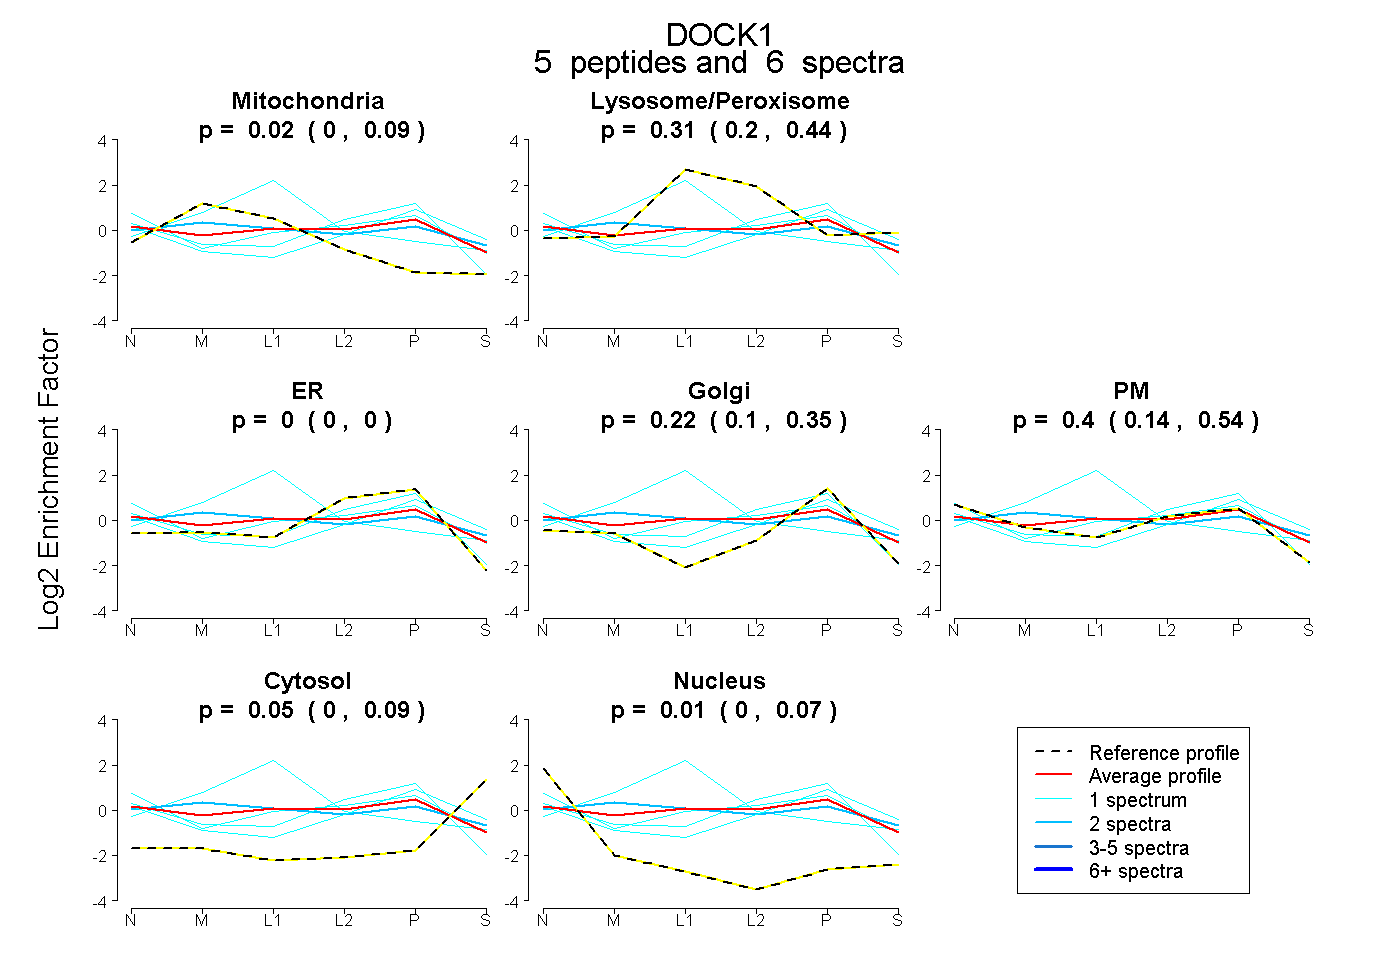 |
0.021
0.000 | 0.086 |
|
0.307
0.203 | 0.436 |
|
0.000
0.000 | 0.000 |
0.222
0.102 | 0.351 |
0.395
0.138 | 0.536 |
0.047
0.000 | 0.095 |
0.008
0.000 | 0.071 |
|
| 2 spectra, LLTQFPNAEK |
0.193 |
|
0.281 |
|
0.000 |
0.222 |
0.229 |
0.075 |
0.000 |
|
| 1 spectrum, VAIPIEDVNR |
0.000 |
|
0.152 |
|
0.000 |
0.409 |
0.274 |
0.166 |
0.000 |
|
| 1 spectrum, HVQIIMEELLR |
0.484 |
|
0.516 |
|
0.000 |
0.000 |
0.000 |
0.000 |
0.000 |
|
| 1 spectrum, EFPHLVDR |
0.000 |
|
0.218 |
|
0.000 |
0.042 |
0.681 |
0.041 |
0.018 |
|
| 1 spectrum, LPGILR |
0.000 |
|
0.002 |
|
0.437 |
0.016 |
0.545 |
0.000 |
0.000 |
|
| | | Plot |
|
Lyso |
|
|
|
|
|
|
|
Other |
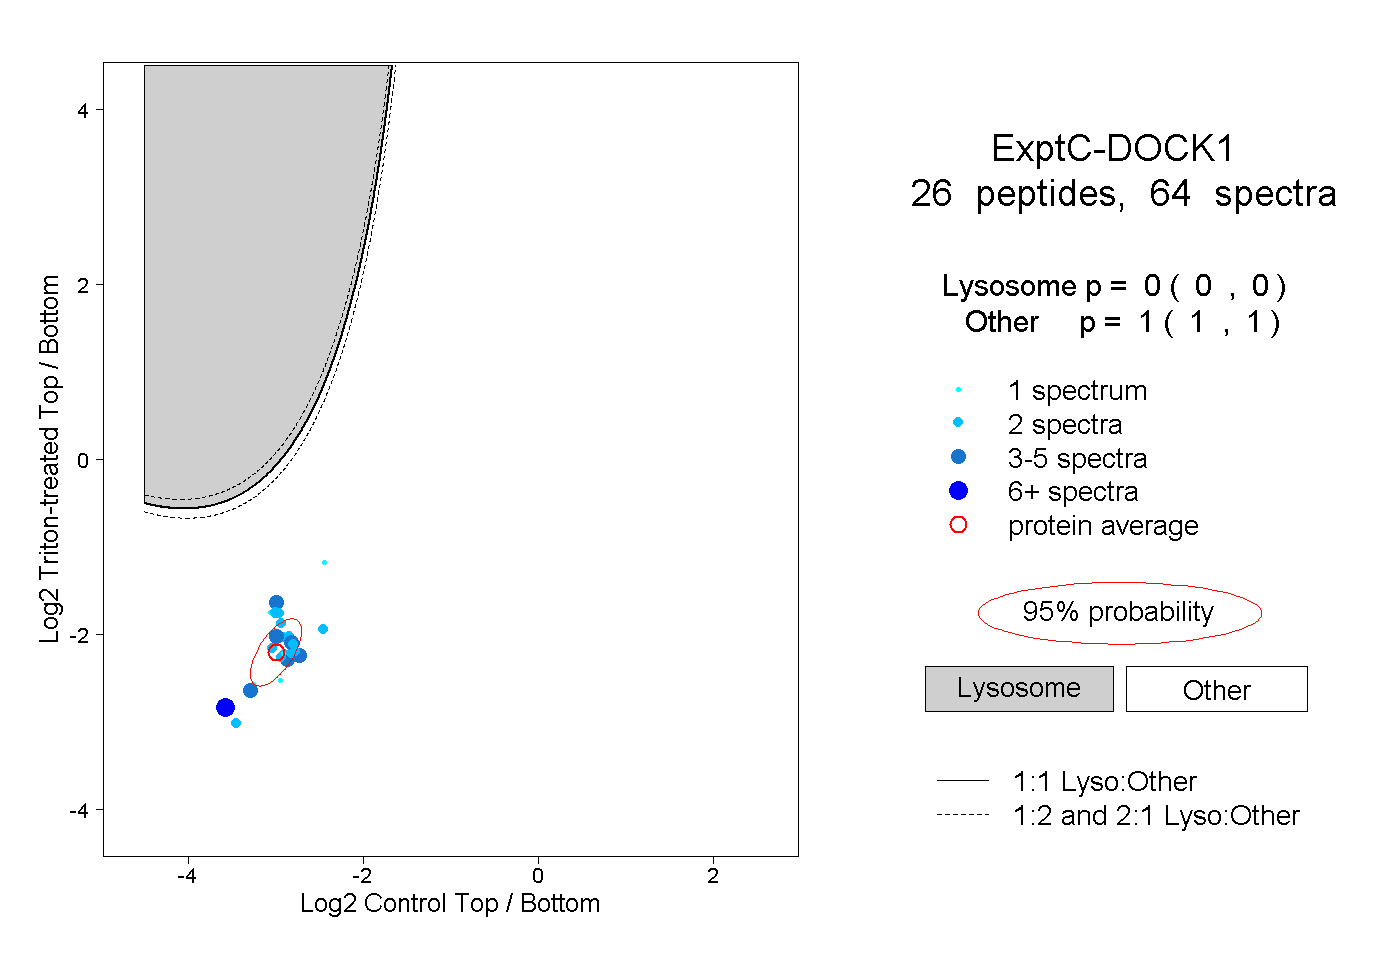
| Expt C |
26
peptides |
64
spectra |
 |
|
0.000
0.000 | 0.000 |
|
|
|
|
|
|
|
1.000
1.000 | 1.000 |
| | | Plot |
|
Lyso |
|
|
|
|
|
|
|
Other |
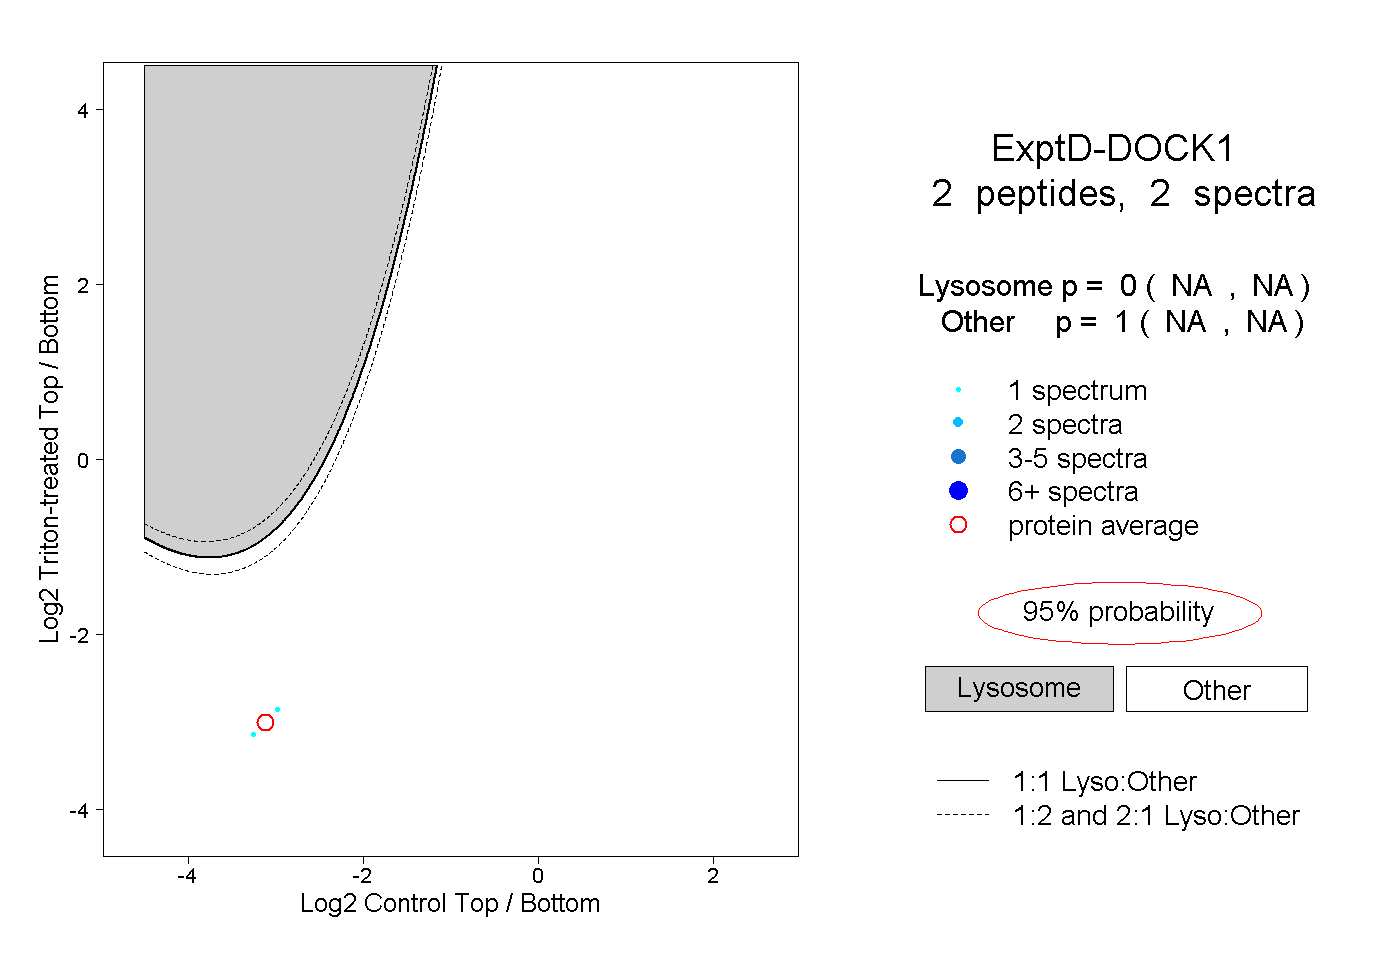
| Expt D |
2
peptides |
2
spectra |
 |
|
0.000
NA | NA |
|
|
|
|
|
|
|
1.000
NA | NA |