 7
7peptides
spectra
0.000 | 0.000
0.000 | 0.038
0.000 | 0.000
0.000 | 0.000
0.000 | 0.027
0.885 | 0.953
0.007 | 0.078
0.000 | 0.024
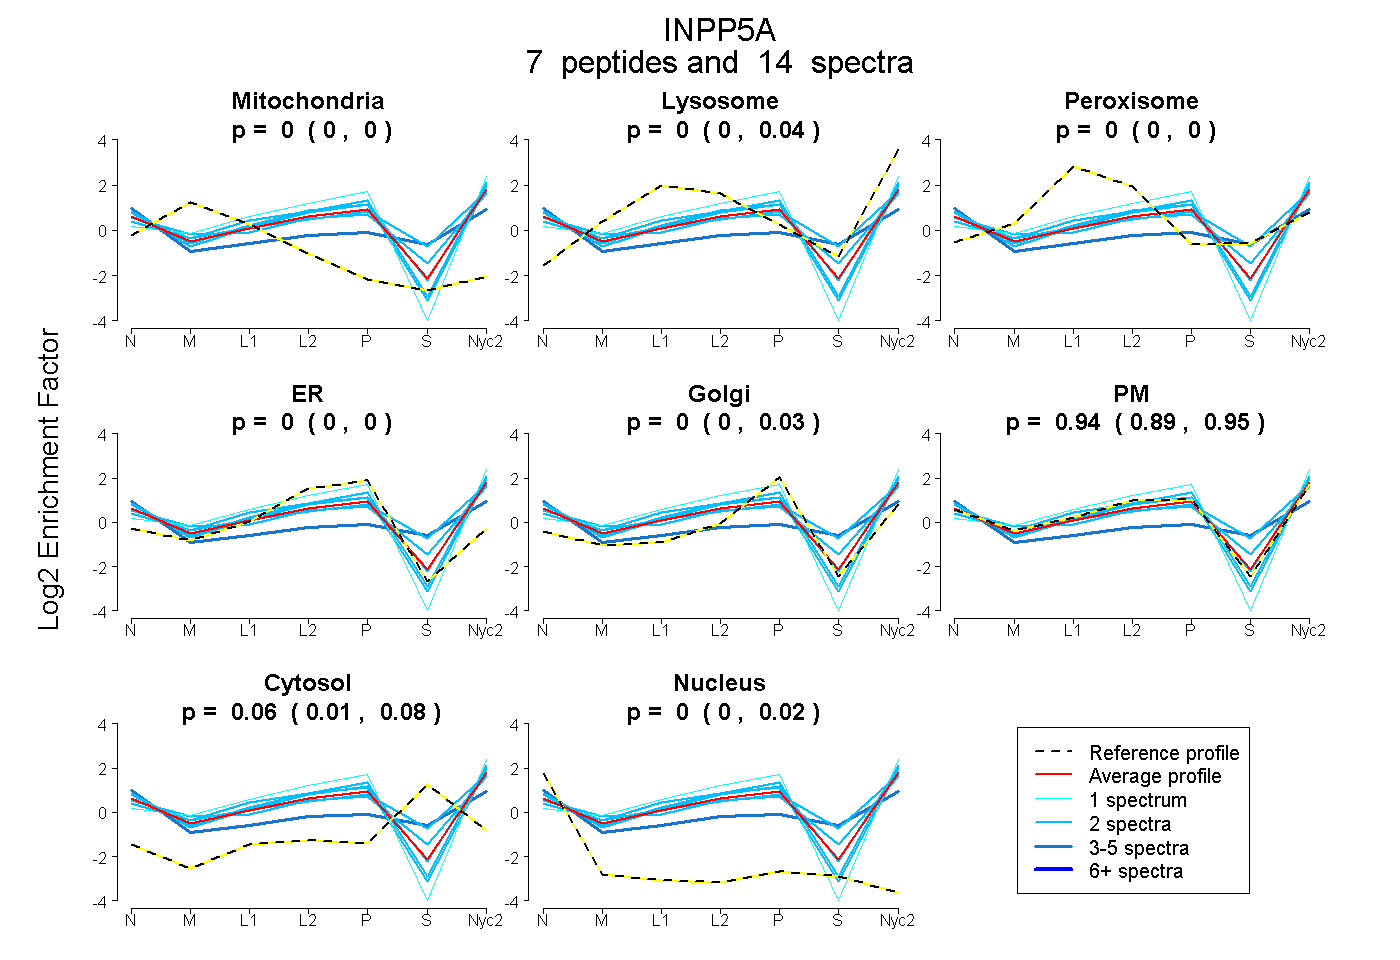
| Plot | Mito | Lyso | Perox | ER | Golgi | PM | Cytosol | Nucleus | |||||
| Expt A |
7 peptides |
14 spectra |
|
0.000 0.000 | 0.000 |
0.004 0.000 | 0.038 |
0.000 0.000 | 0.000 |
0.000 0.000 | 0.000 |
0.000 0.000 | 0.027 |
0.938 0.885 | 0.953 |
0.058 0.007 | 0.078 |
0.000 0.000 | 0.024 |
| 2 spectra, ALGYVLDR | 0.000 | 0.000 | 0.000 | 0.000 | 0.000 | 0.988 | 0.012 | 0.000 | ||
| 3 spectra, EIYSDTLESTPMLEK | 0.000 | 0.000 | 0.000 | 0.000 | 0.000 | 0.620 | 0.324 | 0.056 | ||
| 2 spectra, ATMQTVR | 0.000 | 0.017 | 0.000 | 0.000 | 0.000 | 0.983 | 0.000 | 0.000 | ||
| 2 spectra, VYLDENYK | 0.000 | 0.163 | 0.000 | 0.000 | 0.000 | 0.637 | 0.199 | 0.000 | ||
| 2 spectra, LFDYFNQDVFR | 0.000 | 0.053 | 0.000 | 0.000 | 0.000 | 0.810 | 0.137 | 0.000 | ||
| 2 spectra, NIYQFDFK | 0.000 | 0.000 | 0.000 | 0.000 | 0.000 | 1.000 | 0.000 | 0.000 | ||
| 1 spectrum, VVLQLEK | 0.000 | 0.046 | 0.000 | 0.000 | 0.000 | 0.954 | 0.000 | 0.000 |
| Plot | Lyso | Other | |||||||||||
| Expt C |
10 peptides |
24 spectra |
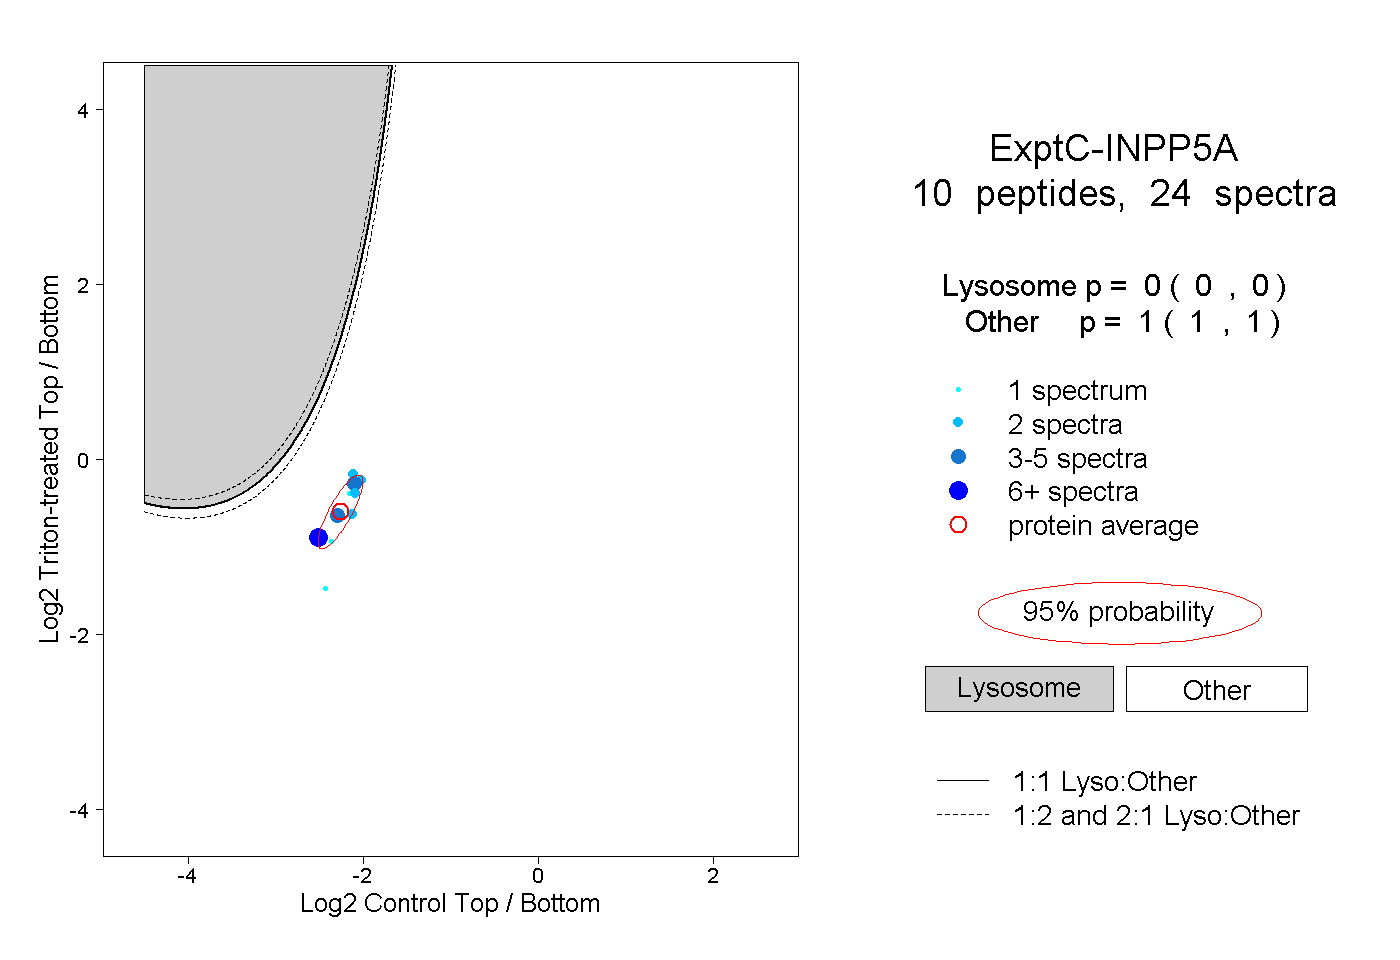 |
0.000 0.000 | 0.000 |
1.000 1.000 | 1.000 |
||||||||
| Plot | Lyso | Other | |||||||||||
| Expt D |
1 peptide |
1 spectrum |
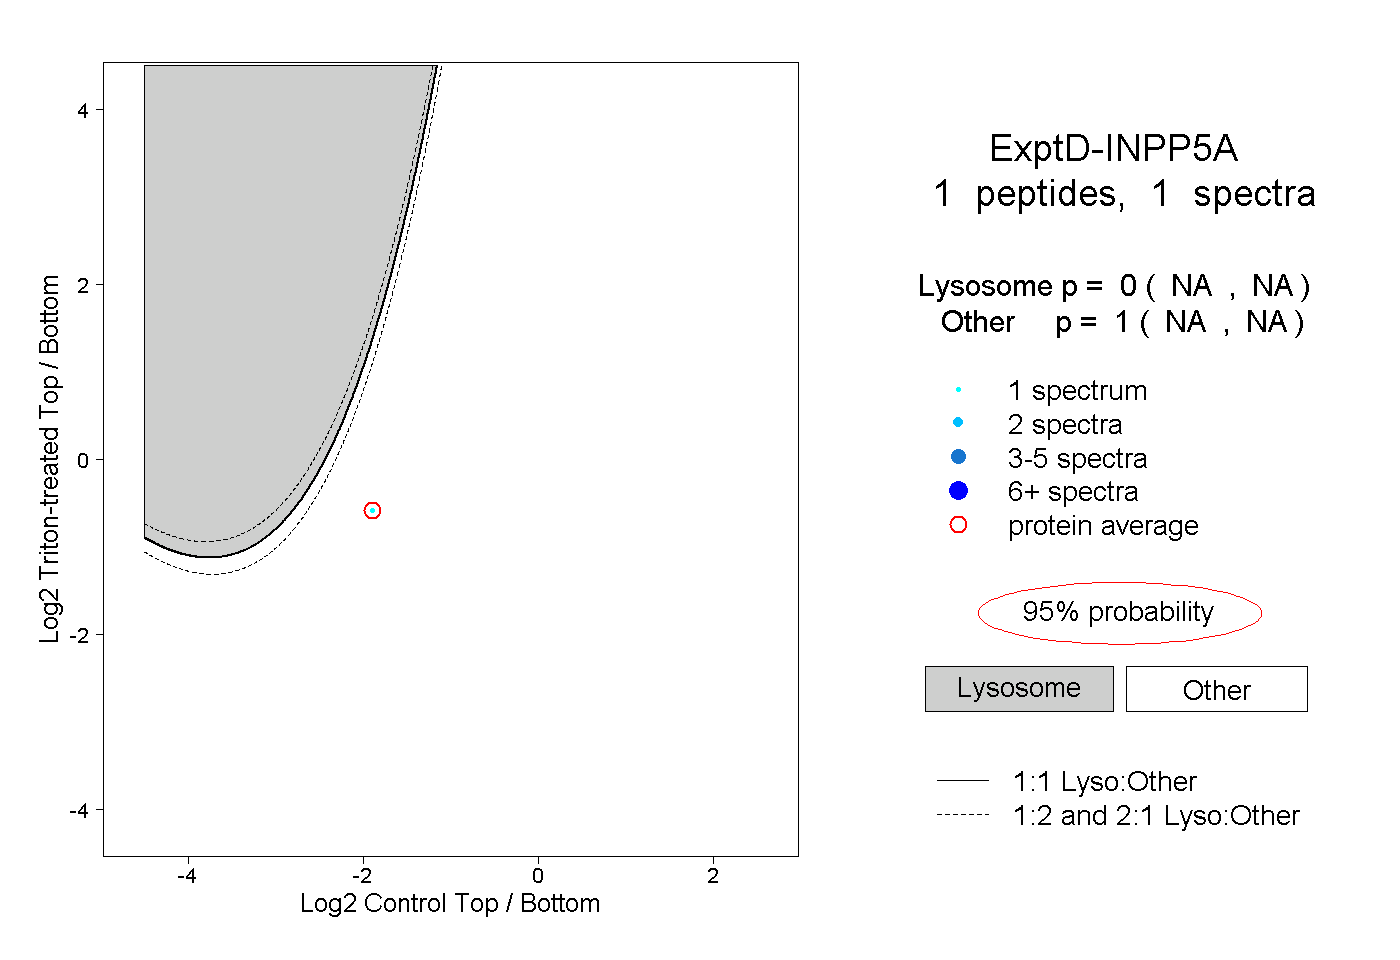 |
0.000 NA | NA |
1.000 NA | NA |