9
9peptides
spectra
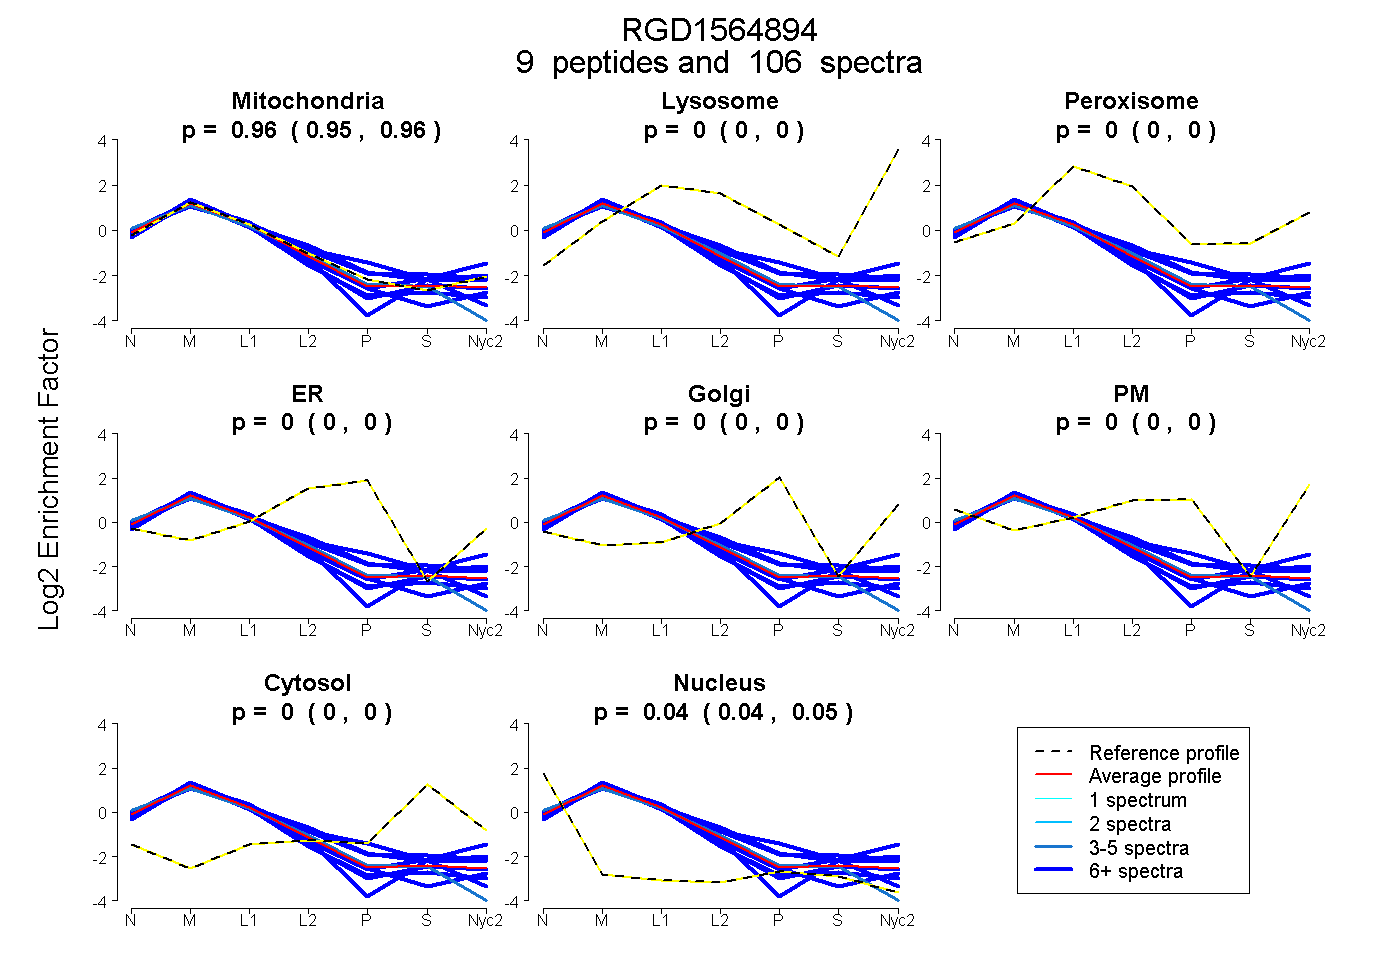
0.954 | 0.959
0.000 | 0.000
0.000 | 0.000
0.000 | 0.000
0.000 | 0.000
0.000 | 0.000
0.000 | 0.000
0.041 | 0.045
9peptides
spectra
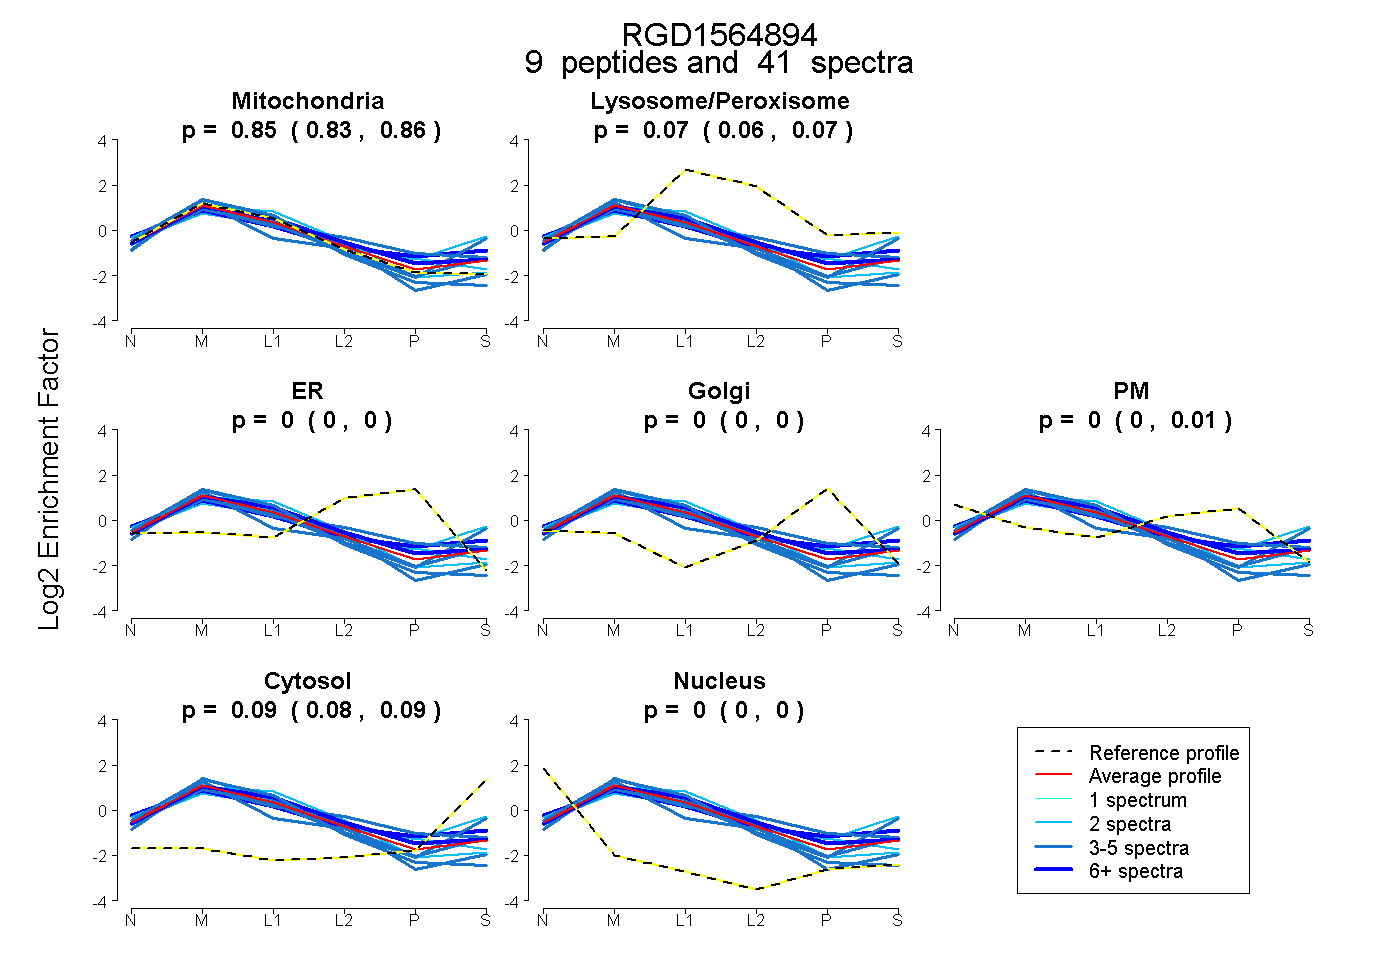
0.831 | 0.859
0.055 | 0.072
0.000 | 0.000
0.000 | 0.000
0.000 | 0.010
0.078 | 0.095
0.000 | 0.000
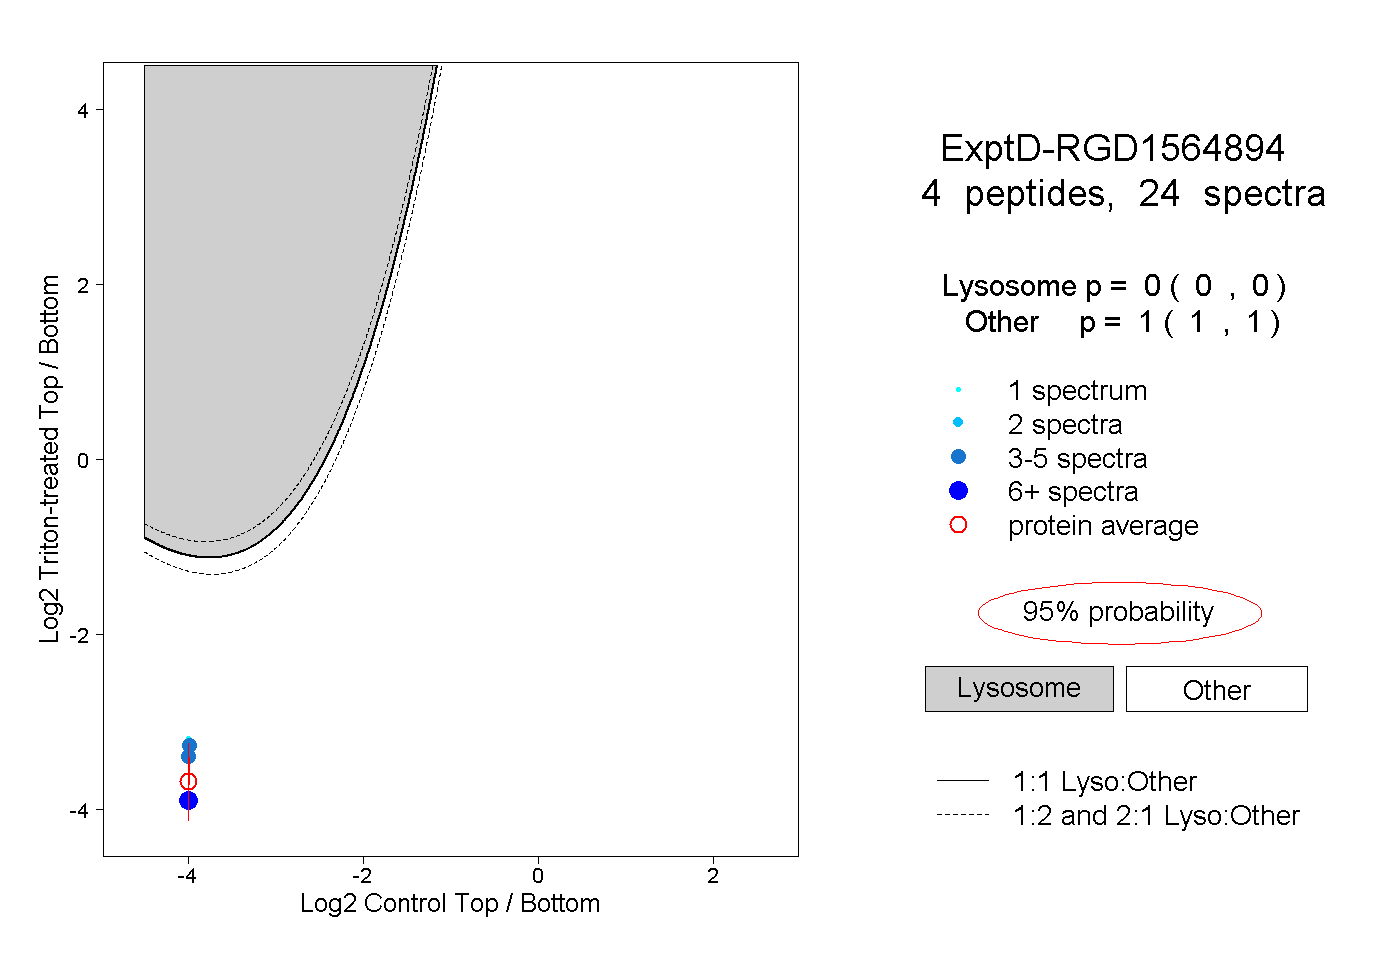
11peptides
spectra
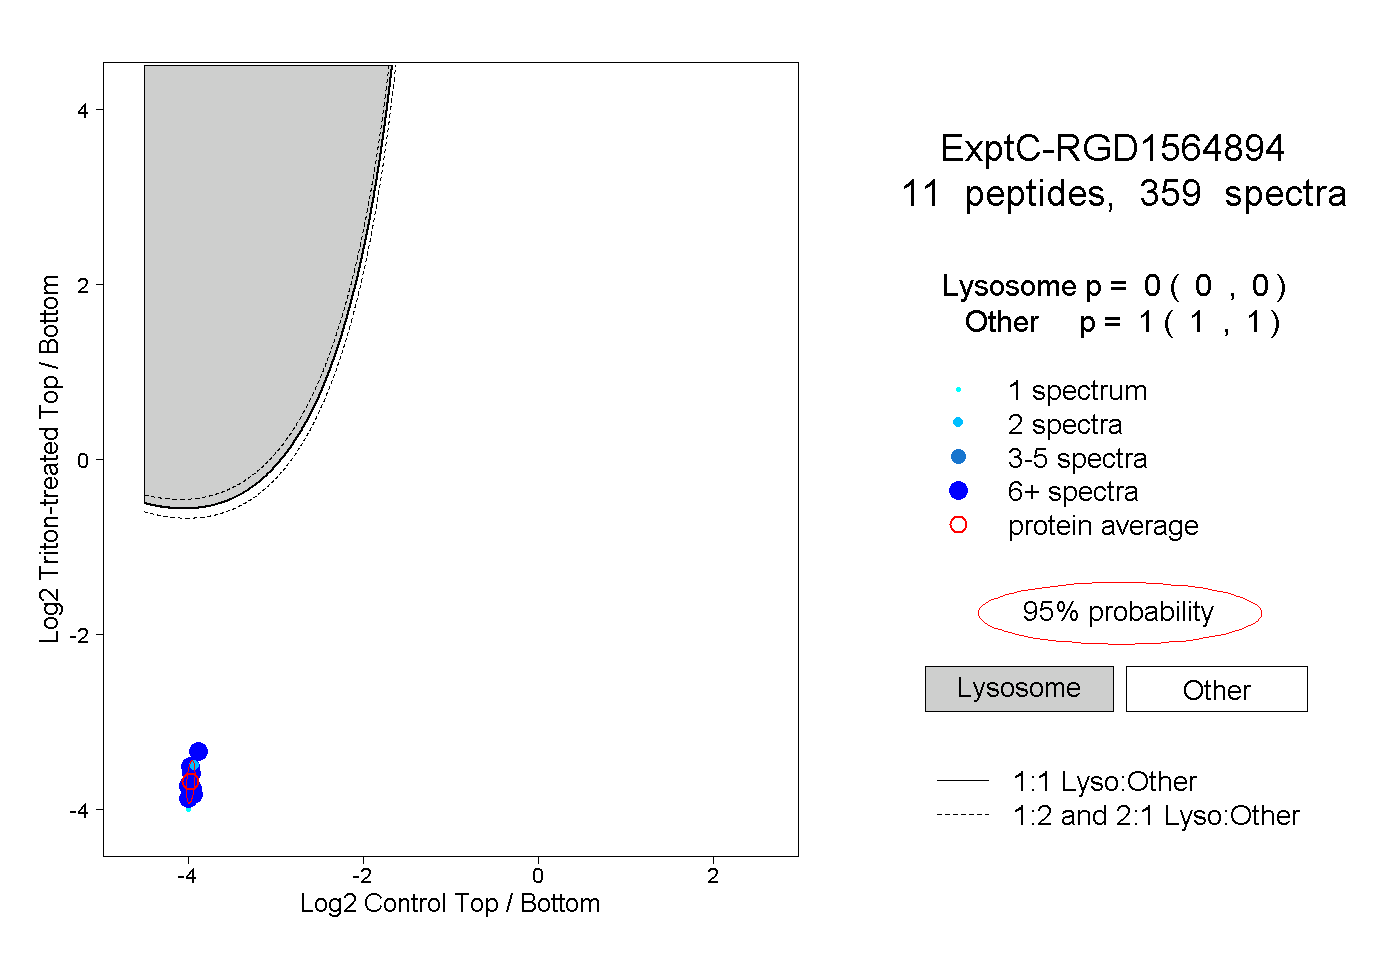
0.000 | 0.000
1.000 | 1.000