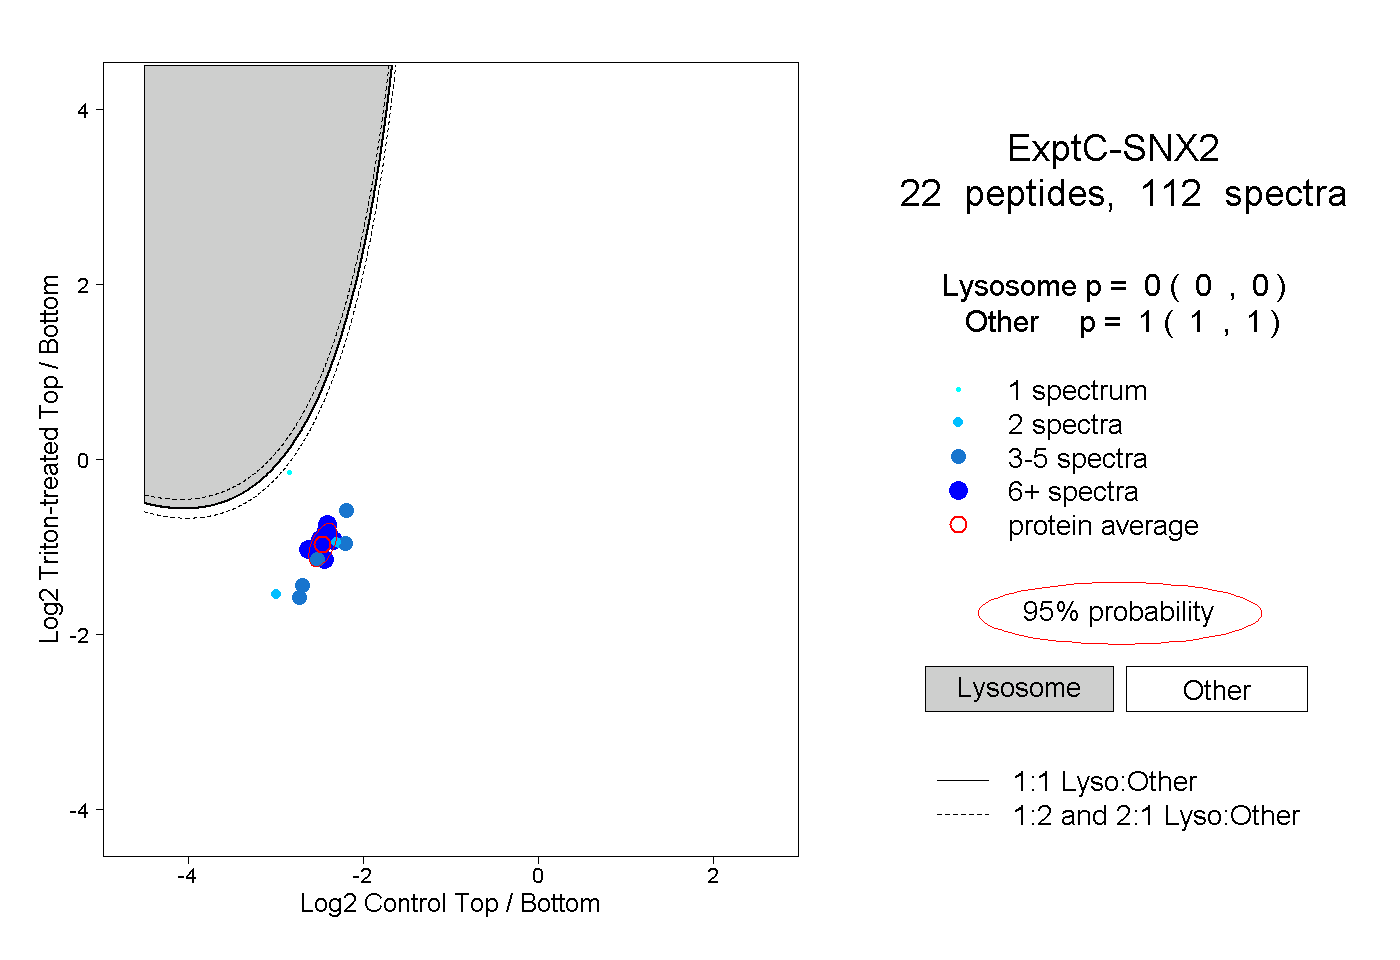
22
22peptides
spectra

0.000 | 0.000
0.000 | 0.000
0.186 | 0.192
0.000 | 0.000
0.257 | 0.260
0.000 | 0.000
0.549 | 0.555
0.000 | 0.000
10peptides
spectra
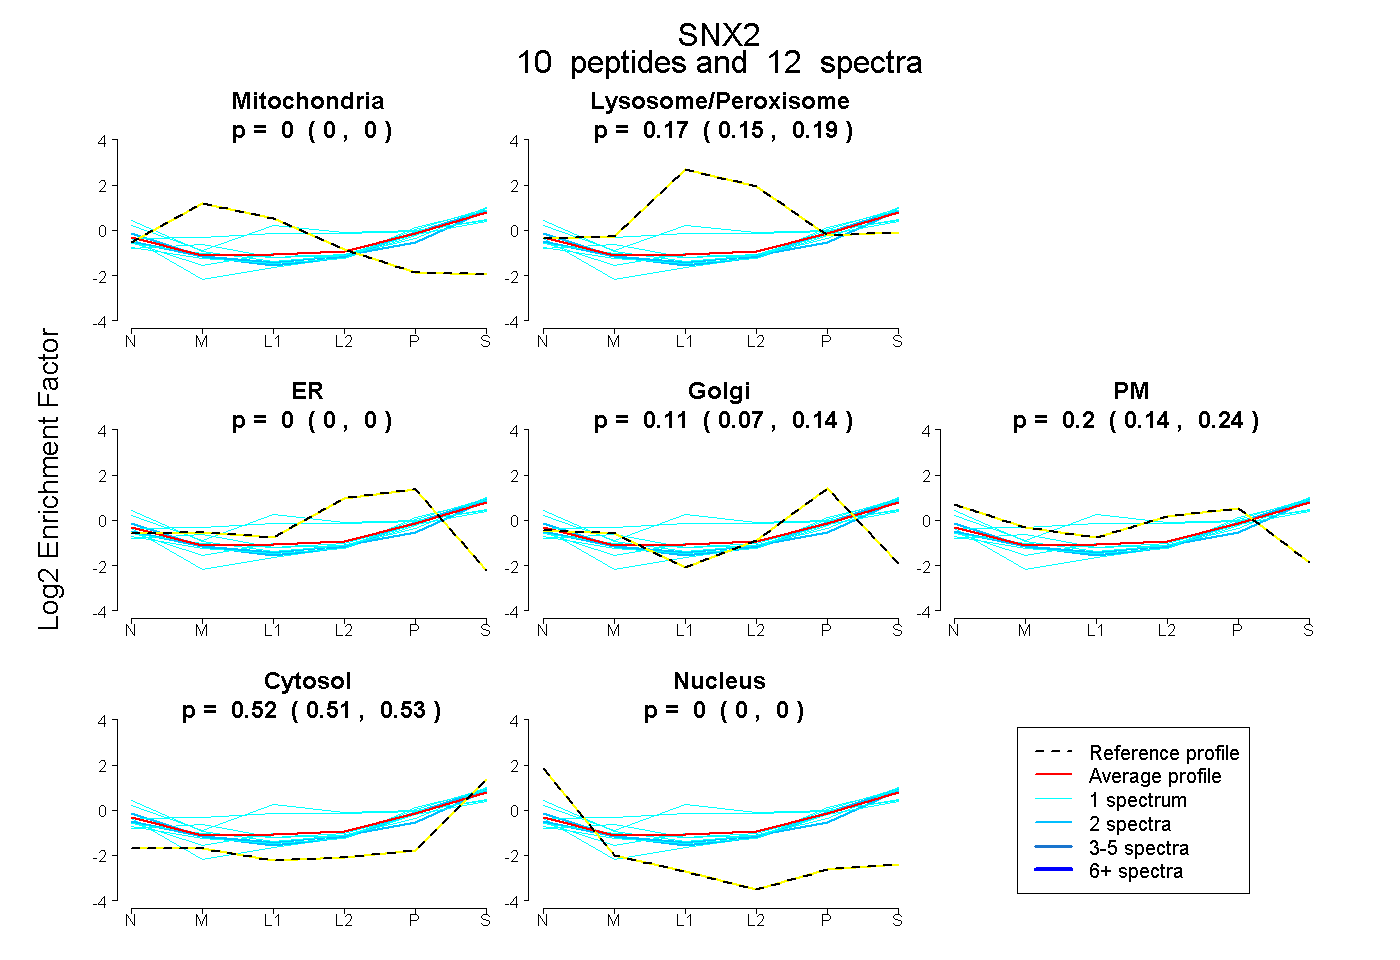
0.000 | 0.000
0.146 | 0.191
0.000 | 0.000
0.074 | 0.143
0.144 | 0.241
0.510 | 0.531
0.000 | 0.000